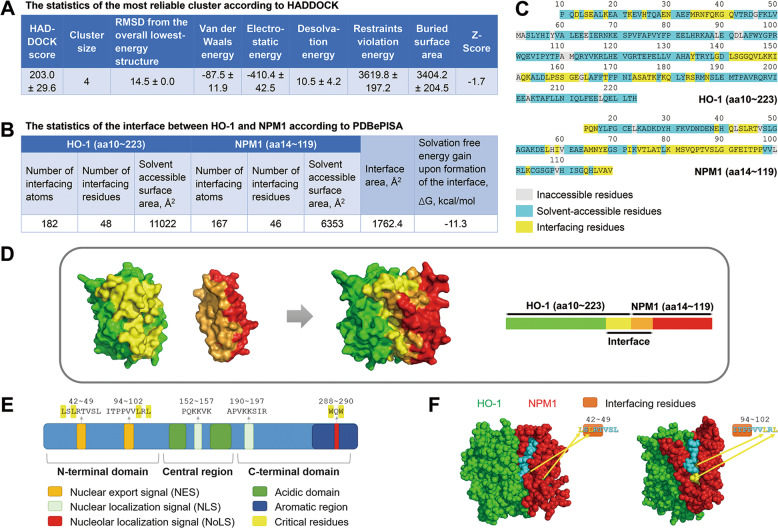
Fig. 7. HO-1-NPM1 docking statistics and visual crystal structure.
A Statistics of the top 1 cluster of HO-1-NPM1 complex according to HADDOCK. B Statistics of interface between HO-1 and N-terminal NPM1 according to PDBePISA. C Specific interfacing residues were demonstrated. D HO-1-NPM1 complex was visualized by PyMOL software. E Structure and functional domains of NPM1. F 3D structure information of interface between HO-1 and N-terminal NPM1.

