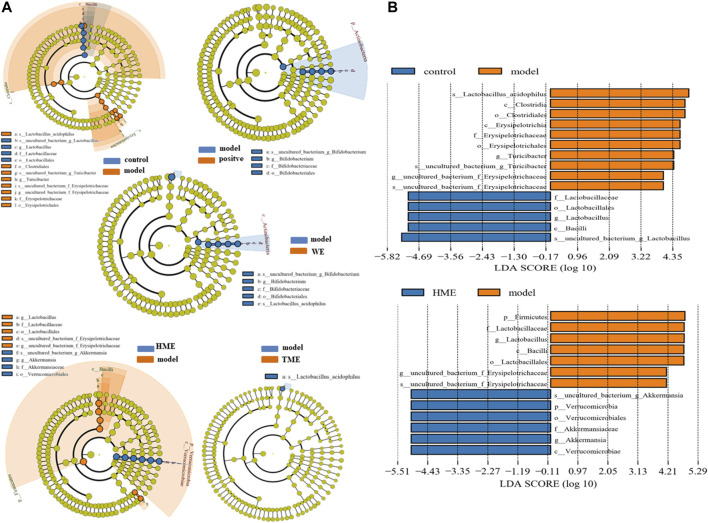
FIGURE 3.
LEfSe results of species differences in intestinal microflora enrichment in rats between different groups. (A) Comparative analysis by cladogram pattern between control and model group or model and WE/HME/TME group. (B) Comparative analysis by LDA histogram only in control/model or model/HME contrast (LDA > 4.0).

