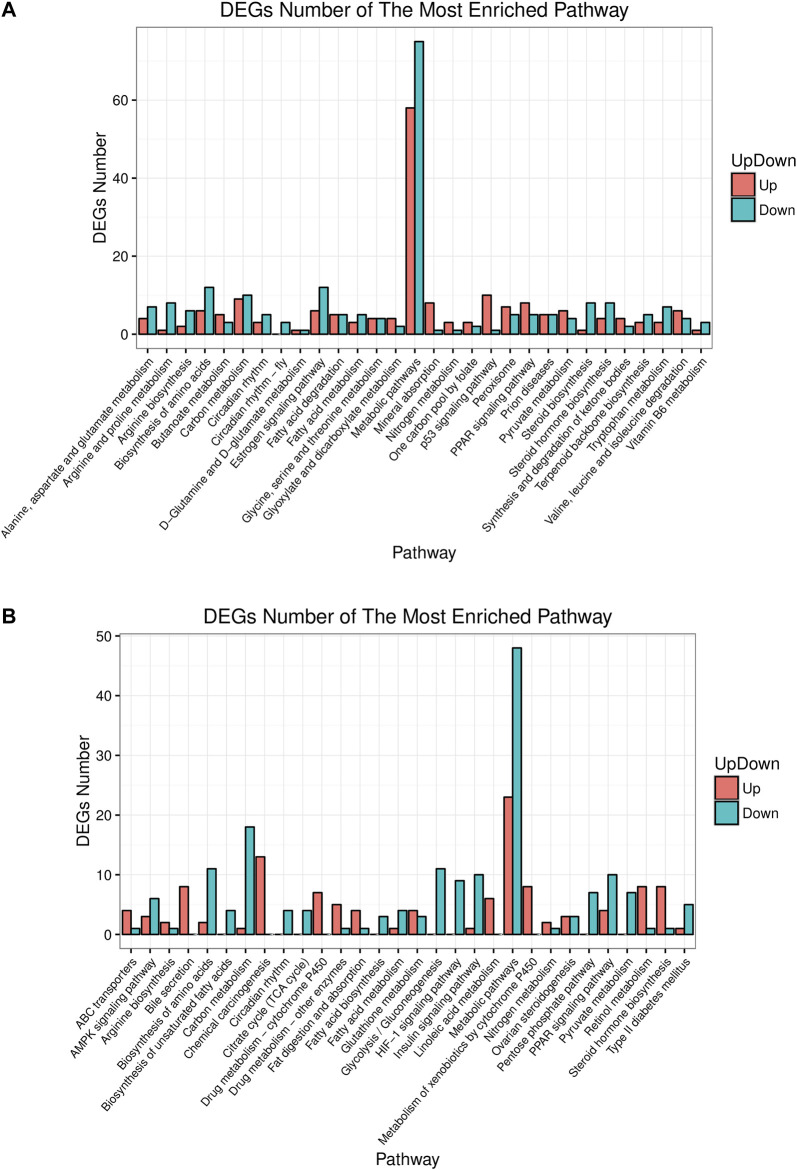
FIGURE 5.
Up or down about differential gene experessions in top 30 enrichment pathways in rat liver between control/model or model/HME. (A) Comparative analysis by histogram pattern between control group and model group. (B) Comparative analysis by histogram pattern between model group and HME group. (differential screening criterion: absolute FC ≥ 0.5, Q-value or FDR ≤ 0.01).

