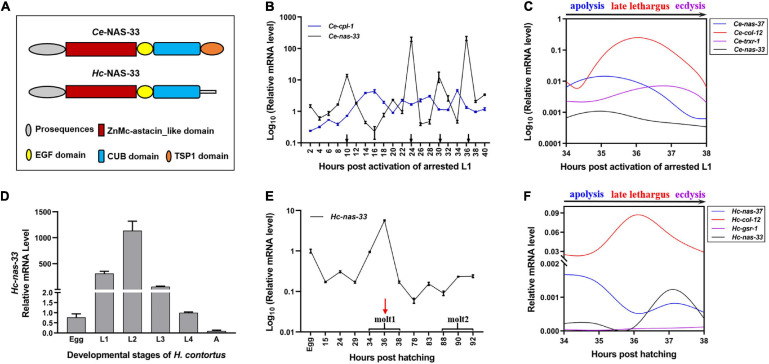
FIGURE 1.
Developmental transcription analysis of nas-33 in Caenorhabditis elegans and Haemonchus contortus. (A) Schematic diagram for domain architectures of Ce-NAS-33 and Hc-NAS-33. (B) Ce-nas-33 shows a tightly regulated transcriptional pattern across four molting periods (black arrows) of C. elegans. (C) Transcriptional alterations of marker genes nas-37, col-12, trxr-1 for apolysis, late lethargus and ecdysis, and nas-33 during the molting of C. elegans. (D) Transcription levels of Hc-nas-33 in different development stages of H. contortus. (E) Hc-nas-33 shows a transcriptional peak during the first molting of H. contortus. (F) Transcriptional alterations of marker genes nas-37, col-12, gsr-1 for apolysis, late lethargus and ecdysis, and nas-33 during the first molting of H. contortus. Error bars indicate mean ± standard deviation (SD). A Non-linear Curve Fit is performed to indicate the dynamic transcriptional changes of marker genes involved in the molting processes.

