Figure 2.
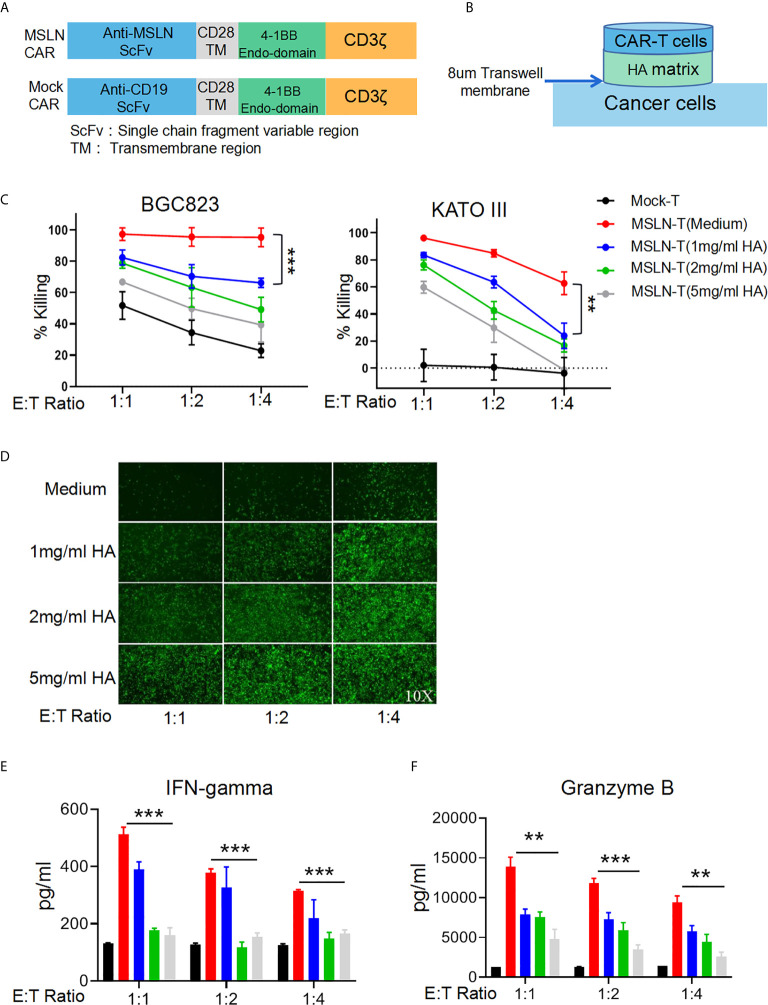
HA restricts T cell mobility and inhibits the antitumor effect of CAR-T cells. (A) Schematic diagram of the structures of CAR gene expression cassettes. (B) Schematic diagram of the Transwell tumor killing coculture system. (C) Results of killing assays performed with anti-MSLN CAR-T cells targeting the gastric cancer cell lines BGC823GL and KATOIIIGL in the Transwell coculture system; error bars denote the S. D, and the results were compared with two-way ANOVA. **P < 0.01. (D) GFP fluorescence images of viable BGC823GL cells at the endpoint of the killing assay at each E:T ratio. (E) Concentrations of IFN-γ and (F) Granzyme B in the supernatant of Transwell chambers at each E:T ratio determined by ELISA; error bars denote the S. D, and the results were compared with an unpaired t test. **P < 0.01; ***P < 0.001.

