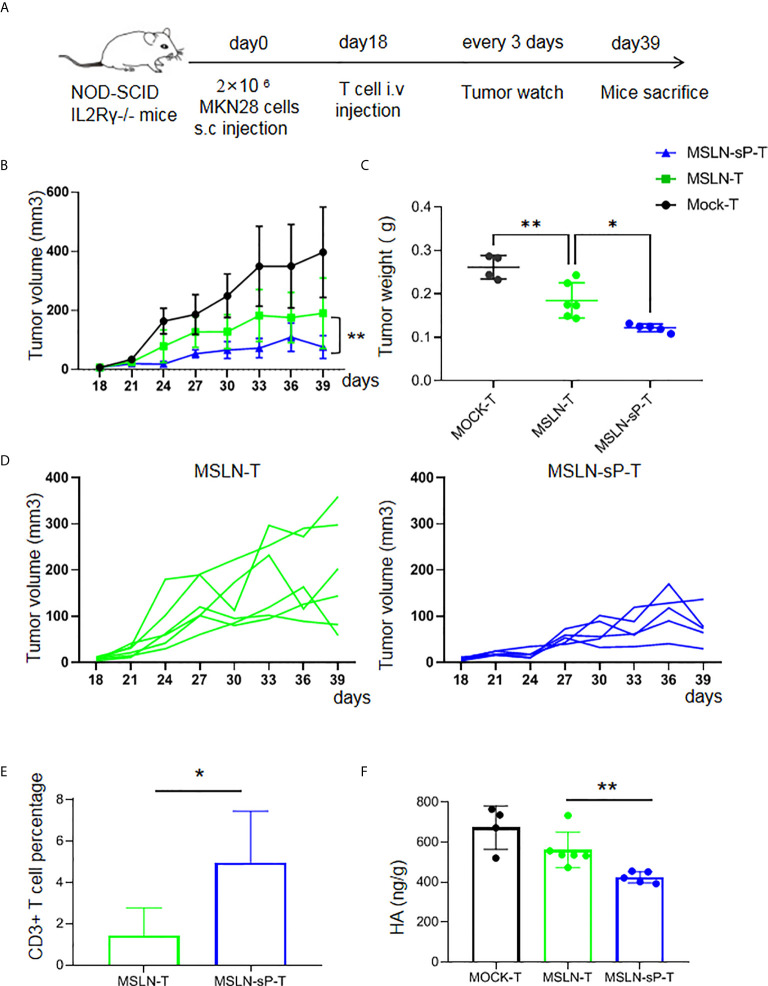
Figure 5.
sPH20-IgG2 enhances the infiltration and antitumor activity of anti-MSLN CAR-T cells in MKN28 gastric cancer mouse model. (A) Schematic diagram of the experiment, n=4 for Mock-T, n=6 for MSLN-T and n=5 for MSLN-sP-T group. (B) Measurement of tumor volumes after treatment with Mock-T, anti-MSLN-T or anti-MSLN-sP-T cells; (C) Tumor weights of the Mock-T, anti-MSLN-T and anti-MSLN-sP-T cell groups on day 39 after tumor injection (time of sacrifice). (D) Tumor growth curves for the individual mice in the anti-MSLN-T and anti-MSLN-sP-T cell groups. (E) Statistical analysis for the percentage of T cells in the tumor tissues of the anti-MSLN-T and anti-MSLN-sP-T cell treated groups. (F) ELISA detection of HA level in the in the tumor tissues of the anti-MSLN-T and anti-MSLN-sP-T cell treated groups. Error bars denote the S. D, and the results were compared with an unpaired t test. *P < 0.05; **P < 0.01.

