Figure 5.

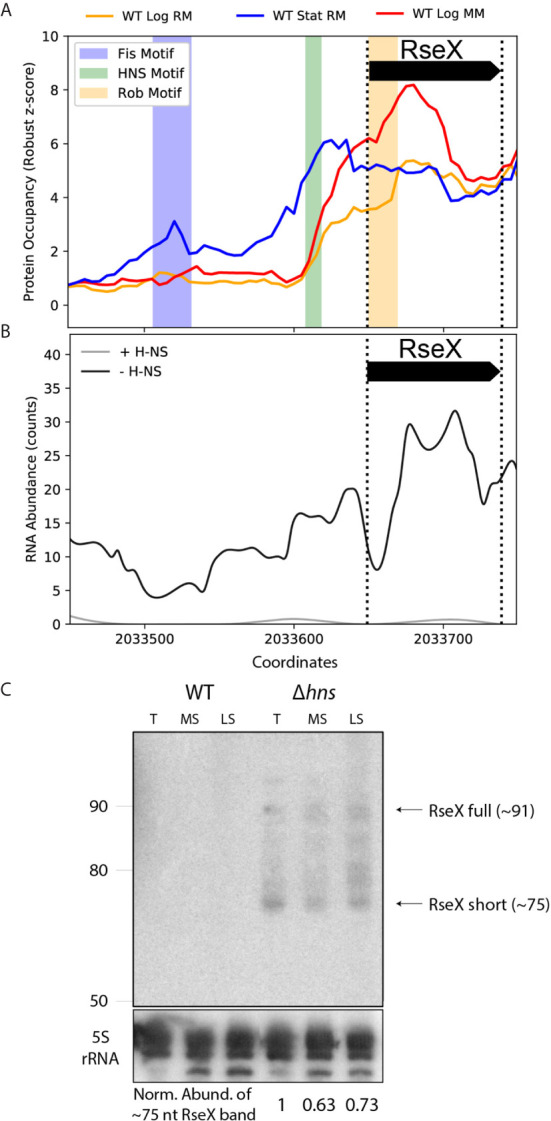
Protein occupancy data and native expression probing support transcriptional RseX repression by nucleoid-structuring protein, H-NS. (A) PO data for the approximate [-200, +10] accepted RseX genomic region (bounded by dashed vertical lines). Three significant PO peaks are observed that contain motifs corresponding to Fis (p-value of 6.1e-05), H-NS (p-value of 5.8e-05), and Rob (p-value of 5.2e-05). (B) RNA-seq counts corresponding to pooled strains of H-NS knockouts versus pooled strains with no modifications to genomic hns (Srinivasan et al., 2013). Expression of RseX and surrounding areas is enhanced in the absence of H-NS. (C) Northern blotting for RseX in wildtype BW25113, and an isogenic, cured hns-deletion strain, grown in LB, at exponential transition to stationary (T, 7 hours post seeding), mid stationary (MS, 24 hours post seeding) and late stationary (LS, 48 hours) growth phases. Lanes for the different cell strains are indicated. RseX expression (documented sRNA, ~91nt) is seen in the Δhns strain at all sampled timepoints besides exponential phase (not shown). A smaller band corresponding to RseX, “RseX short” (~75 nt, size estimated from ladder interpretation, left, as described in Methods), suggests post-transcriptional processing or early transcription termination. RseX expression is not observed in a wildtype strain at any growth phase. Expression of the ~75 nt RseX short transcript is normalized to a 5S rRNA control (bottom).
