Fig. 1.
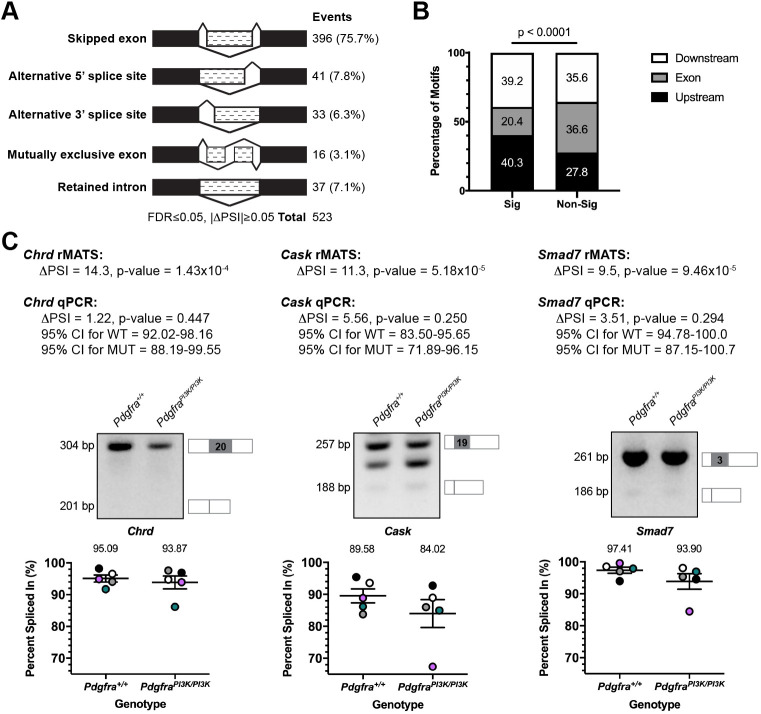
Differential alternative splicing of select transcripts in response to PI3K-mediated PDGFRα signaling. (A) Summary of differential AS events detected by rMATS analysis of RNA-seq data from E13.5 Pdgfra+/+ versus PdgfraPI3K/PI3K PS mesenchyme. n=3 biological replicates per genotype. FDR, false discovery rate; ΔPSI, difference in percent spliced in. (B) Bar graph depicting percentage of Srsf3 motifs detected by RBPmap within or flanking exons between significant (Sig) and non-significant (Non-Sig) skipped exon events. Statistical analyses were performed using a χ2 test. (C) ΔPSI values for three differentially alternatively spliced transcripts between E13.5 Pdgfra+/+ versus PdgfraPI3K/PI3K PS mesenchyme as assessed by rMATS analysis of RNA-seq data and qPCR. Representative qPCR gels with depictions of differentially alternatively spliced exon (gray), and upstream and downstream sequences that were assessed by qPCR, as well as scatter dot plots depicting percent spliced in, as assessed by qPCR, are presented. Data are mean±s.e.m. Statistical analyses were performed using a paired t-test. Colored circles correspond to independent experiments. n=5 biological replicates per genotype. CI, confidence interval; WT, Pdgfra+/+; MUT, PdgfraPI3K/PI3K.

