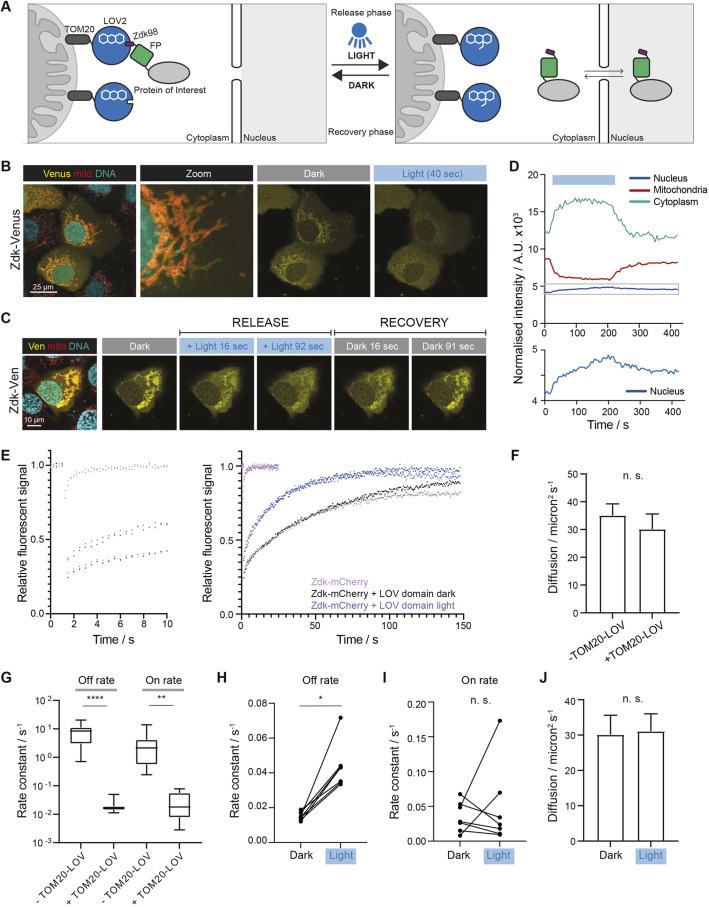
Fig. 1.
Establishment and analysis of a system for light-dependent release of proteins from sequestration. (A) Diagram shows the opto-release system design. In the dark, Zdk-tagged protein of interest is sequestered on the mitochondria through the interaction with the light-sensitive LOV domain. The LOV domain is tethered to the mitochondria through the TOM20 protein anchor. Upon blue light illumination, the LOV domain changes conformation and releases the Zdk-tagged protein. (B) Representative images of cells expressing the Zdk–Flag–Venus (yellow) construct without and with blue light illumination in the presence of sequestering TOM20–Flag–LOV (transient transfection in HaCaT cells). Mitochondria (mito; red) and DNA (cyan) are visualised in live cells using MitoTracker and DRAQ5, respectively. The zoomed-in image highlights Zdk–Flag–Venus localisation to the outer mitochondrial membrane. (C) Representative images from a movie of release (period of blue light illumination) followed by recovery (cessation of blue light illumination) of the Zdk–Flag–Venus (Ven; yellow) construct from TOM20–Flag–LOV in a transiently transfected HaCaT cell. Mitochondria (red) and DNA (cyan) are visualised in live cells using MitoTracker and DRAQ5, respectively. (D) Quantification of normalised intensity of mitochondria, cytoplasm and nucleus compartments corresponding to the optogenetic release and recovery experiment performed in C. Intensity is corrected for bleaching and background signal. Lower panel shows the nuclear compartment using an expanded y-axis scale (for the region highlighted by the grey box in the upper panel). The blue box indicates the period of blue light illumination. A.U., arbitrary units. Data are representative of 29 cells from six experiments, including control experiments using either Zdk–Venus or Zdk–mCherry. (E) Graph showing relative Zdk–Flag–mCherry fluorescence intensity in the bleached region following photobleaching in the absence of TOM20–Flag–LOV sequestration (purple and lilac, indicating data from two exemplar cells) or the presence of TOM20–Flag–LOV sequestration (black, grey, dark blue and light blue). Two exemplar cells are shown for each condition with distinct shading for each cell. The black and dark blue data points are from the same cell either in the dark (black) or under blue light (dark blue). Similarly, grey and light blue data points are from the same cell either in the dark (grey) or under blue light (light blue). The graph on the left represents the first 10 s of the experiment, while the graph on the right shows the full duration of the experiment. Data are representative of 22 cells from three experiments. (F) Bar graph (median+95% c.i.) of Zdk–Flag–mCherry diffusion rates in the presence or absence of TOM20–Flag–LOV sequestration; n≥13 cells from at least two experiments. (G) Boxplot of Zdk–Flag–mCherry off rate constants (left) and on rate constants (right) in the presence and absence of TOM20–Flag–LOV sequestration; n≥13 cells per condition from at least two experiments. Boxes represent the interquartile range, lines mark the median and whiskers show the range. (H) Paired values of mitochondria off rate constant of Zdk–Flag–mCherry release from the mitochondria in the dark or with blue light illumination in the same cell, derived using the FRAP methodology; n=7 cells. (I) Paired values of mitochondria on rate constant of Zdk–Flag–mCherry recovery to the mitochondria in the dark or with blue light illumination in the same cell, derived using the FRAP methodology; n=7 cells. (J) Bar graph (median+95% c.i.) of Zdk–Flag–mCherry diffusion rates in the dark or with blue light illumination; n≥13 cells per condition. All cells were co-transfected with TOM20–LOV. *P<0.05; **P<0.01; ****P<0.0001; n.s., not significant (Mann–Whitney test).

