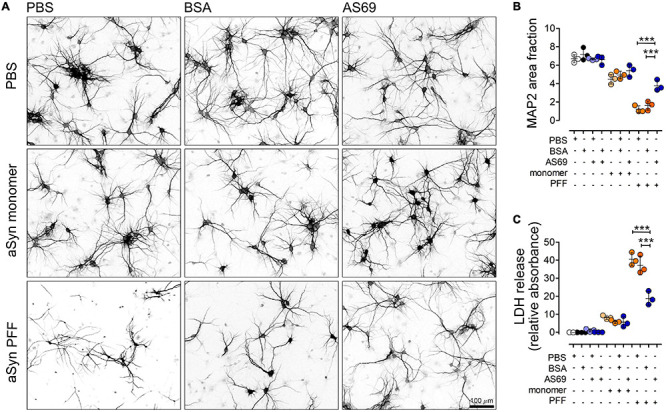
FIGURE 3.

AS69 decreases aSyn-induced degeneration in primary neurons. (A) Representative images of primary neurons stained for MAP2 10 days after treatments as indicated. Scale bar: 100 μm. (B) Quantification of the area positive for MAP2 in neurons as depicted in panel (A) (n = 3 independent preparations, ≥10 image fields per experiment/group). Two-way ANOVA showed positive interaction (p = 0.004) (p-values of Bonferroni post hoc tests depicted). (C) Quantification of LDH release in primary neuronal cultures with groups as in panel (A). Two-way ANOVA showed positive interaction (p = 0.004) (p-values of Bonferroni post hoc tests depicted). All markers represent the mean of all technical replicates of one individual preparation; lines represent mean ± SD of n = 3 independent preparations. ***p < 0.001.
