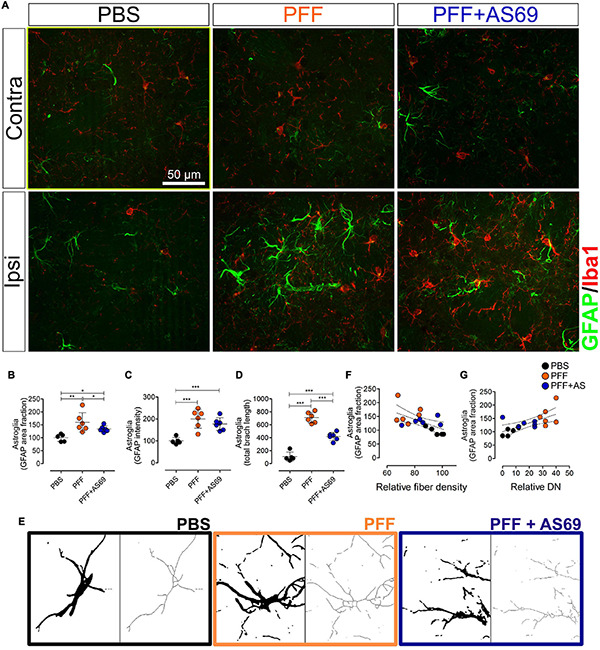
FIGURE 6.

AS69 decreases PFF-induced astrogliosis. (A) Representative images of striatal sections ipsilateral and contralateral to the PFF injection stained for astroglia (GFAP, green) and microglia (Iba1, red) 90 days after PFF injection. Scale bar: 50 μm. (B–D) Astroglia reaction expressed as GFAP-positive area fraction (B), GFAP staining intensity (C), and skeleton branch length (D) in the injected hemisphere relative to the contralateral hemisphere with the PBS-injected group set to 100%. p-values from one-way ANOVA followed by Bonferroni post hoc test. Absolute values for individual hemispheres are in Supplementary Figures 3D–F. (E) Representative images of individual astroglia after binarization (left panels) and after skeletonization (right panels) as used for panel (D). (F) Linear regression of astroglia activation (from panel B) vs. density of dopaminergic fibers in the striatum (from Figure 5B), p = 0.0159; r2 = 0.3298. (G) Linear regression of astroglia activation (from panel B) vs. DN in the striatum (from Figure 3D), p = 0.0046; r2 = 0.4238. In panels (B–G), markers represent individual animals. In panels (B–D), lines represent mean ± SD. In panels (F,G), dotted lines represent linear regression and 95% confidence interval. n = 5 (PBS) or 6 (PFF, PFF + AS69) animals. *p < 0.05; **p < 0.01; ***p < 0.001.
