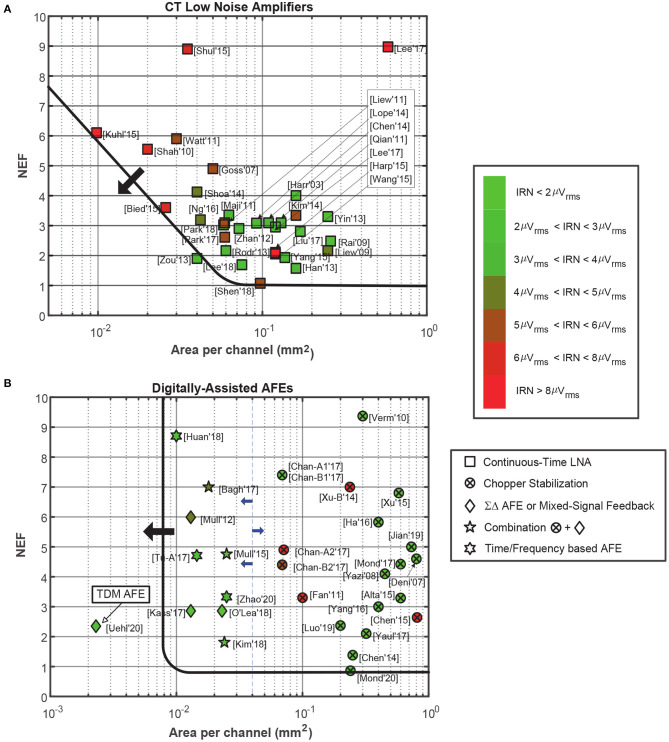
Figure 6.
Comparison of state-of-the-art LNAs and AFEs topologies in terms of NEF and area per channel. The green-red scale indicates the value of the IRN for each reported circuit. In both figures, arrows indicate the limit on the trend of current circuits, and how future approaches should be beyond the marked line. (A) For CT LNAs. (B) For Digitally-Assisted AFEs.

