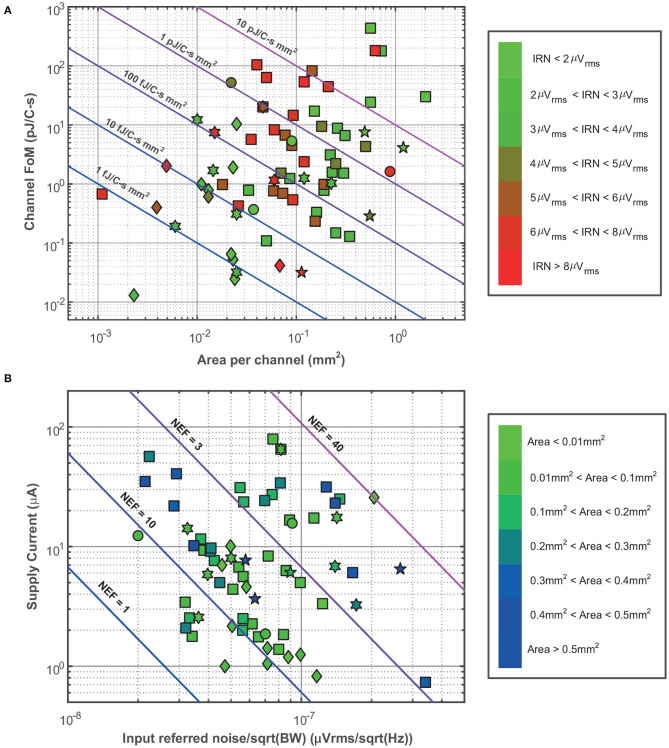
Figure 7.
Comparison of state-of-the-art LNAs and AFEs topologies in terms of Channel FoM and normalized IRN. (A) Channel FoM vs. area per channel comparison. The green-red scale indicates the value of the IRN of each reported circuit. The lines shows different FoM per area values as references. (B) Supply current vs. normalized IRN comparison. The green-blue scale indicates the value of the occupation area of each reported circuit. The lines show different NEF values as references. The employed symbol code is the same as shown in Figure 6.

