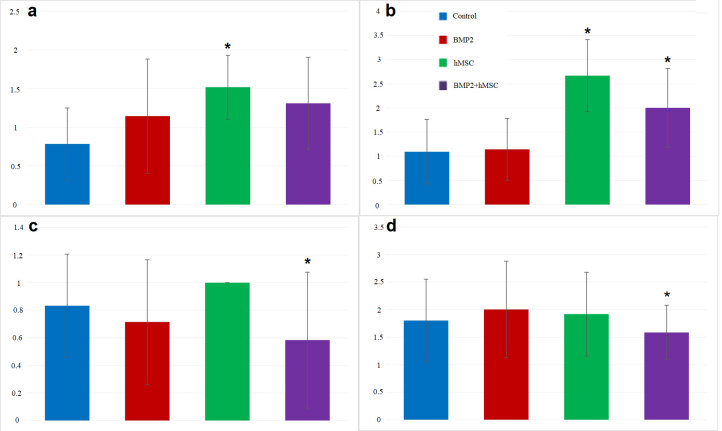
Figure 3.
a. The dimensions of tumor (milimeter). The dimensions of tumor in hMSC group were found significantly higher than control group (*p < 0.01). There was no significant relation between the control group and BMP2+hMSC group. b. The extent of necrosis in tumor tissue. The extent of necrosis in the tumor tissue were found significantly greater in hMSC and BMP2+hMSC groups than control group (*p < 0.05). c. The number of metastatic foci. The number of metastatic foci were significantly lower in BMP2+hMSC group than in hMSC group (*p < 0.01). d. p27 immunostaining of tumor tissues. p27 staining level was significantly lower in BMP2+hMSC group than in hMSC group (*p < 0.05).

