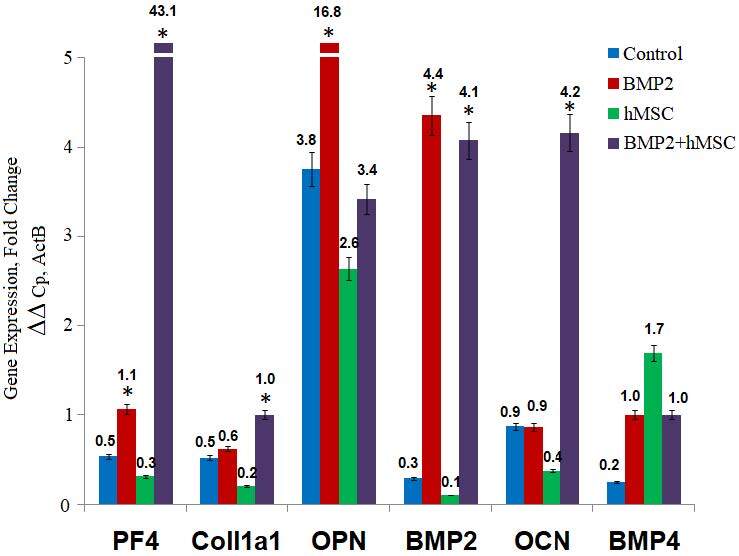
Figure 6.

Gene expression analyses in vivo. Gene expression analysis of tissues transplanted with BMP2+hMSC. The expression of PF4, COL1A1, OPN, BMP2, OCN and BMP4 were evaluated. BMP2+hMSC group, in which the transplanted cells were cotransfected with BMP2 and GFP, was compared to BMP2 group, hMSC group and the control group. The significance of the results with respect to the control group was indicated by asterix (*) when p < 0.01.
