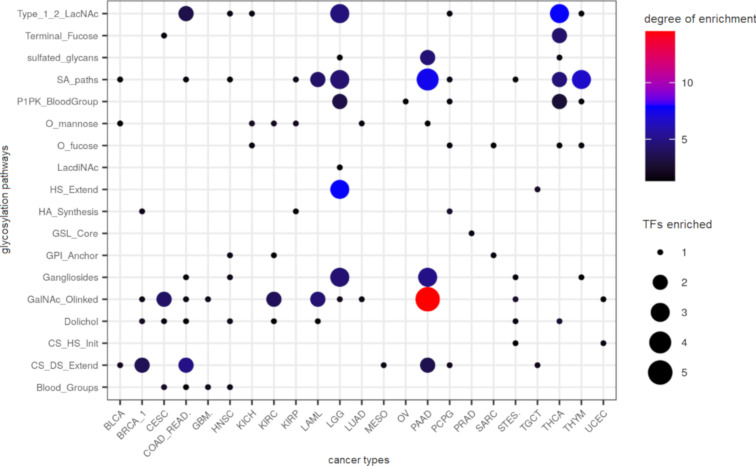
Figure 6.
Summary of TF–glycopathway enrichments across all cancer types: TF enrichments to glycopathways across all cancer types are depicted as dots (Fisher’s exact test adjusted P < 0.05 for overrepresentation). The dot size corresponds to the number of TFs that were found to regulate the pathway. The degree of regulation is defined as the sum of all −log10 (adjusted enrichment p-values) across all TFs for a given cancer–glycopathway pair.

