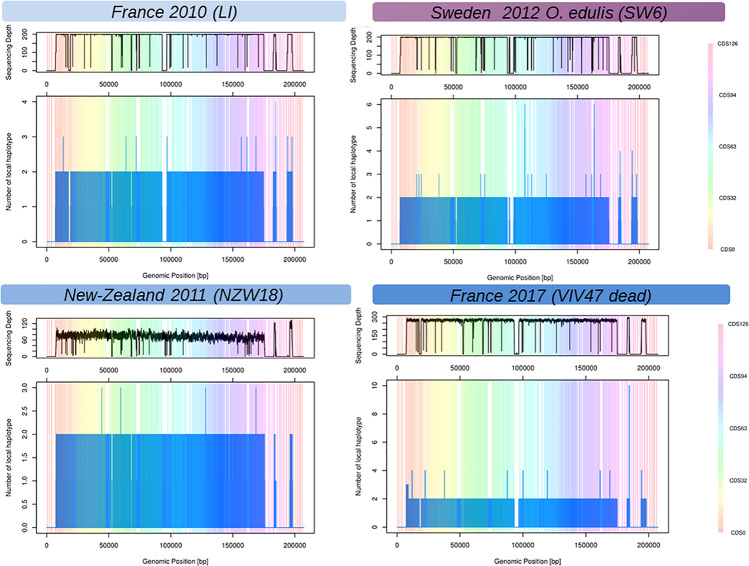
FIGURE 2.
Reconstructed local viral haplotypes for four samples using Shorah with amplicon mode (Zagordi et al., 2011). The X-axis represents the genomic position within the reference viral genome (Davison et al., 2005). The Y-axis is the number of reconstructed viral haplotypes on the focal genomic position. The vertical-colored bands represent the span of the coding DNA sequence (CDS) of the reference viral genome (Davison et al., 2005), one color represents one CDS numbered from 1 to 127. The top panels above the plots represent the coverage depth across the viral genome. Low or no sequencing depth on a genomic region could be interpreted as genomic deletion on the considered samples.

