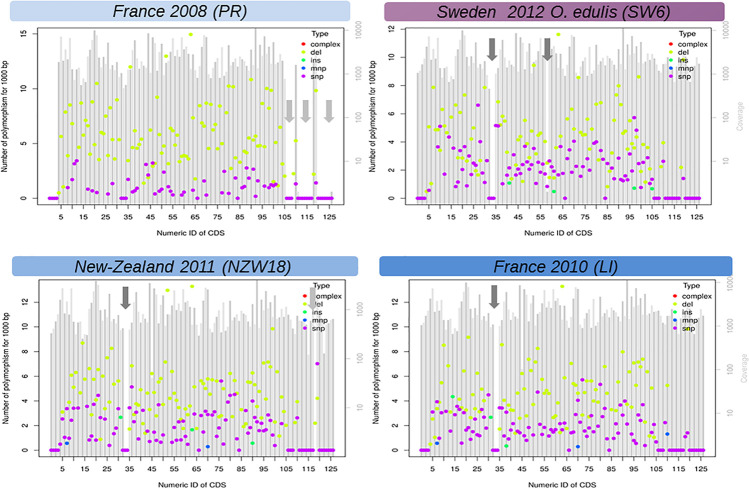
FIGURE 3.
Functional view of DNA variation (mutations) density along the genome of Ostreid herpesvirus 1 (OsHV-1). Here only LI, PR, NZ17, and SW6 are shown. The X-axis is the number of CDS found in the reference annotation genome last accessed (Davison et al., 2005) and the Y-axis is a standardized count of mutations found in 1,000 bp if the SNP density where the same in the targeted CDS. Genomic regions with a low complexity content (repeated sequences) were not considered in this analysis (light gray arrows). SNP, single nucleotide polymorphism; INS, short insertion (<50 bp); DEL, short insertion (<50 bp); MNP, short complex polymorphism, dark gray arrows: large deletion (>50 bp). Figures of all samples (detailed Table 1) are given in Supplementary Files.

