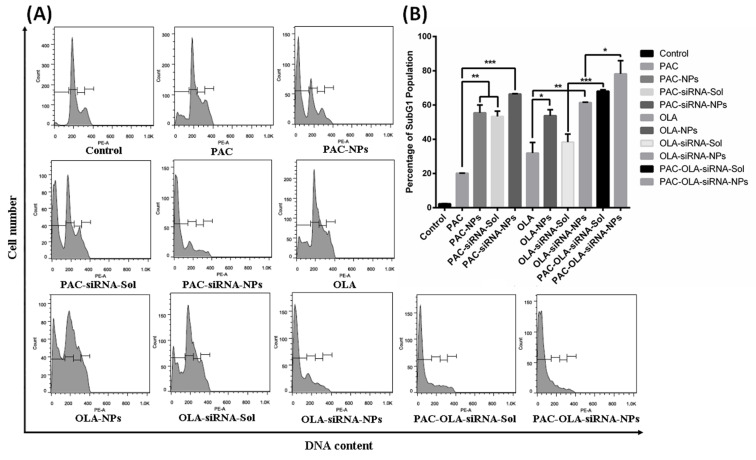
Fig. 7.
Apoptosis analysis by cell cycle study using flow cytometry. (A) Histograms representing different cell cycle phases and (B) SubG0/G1 phase cell population indicating the apoptotic cells after treatment of MDA-MB-231 cells with different treatment groups. Data represented as mean ± S.E.M. (n = 3).

