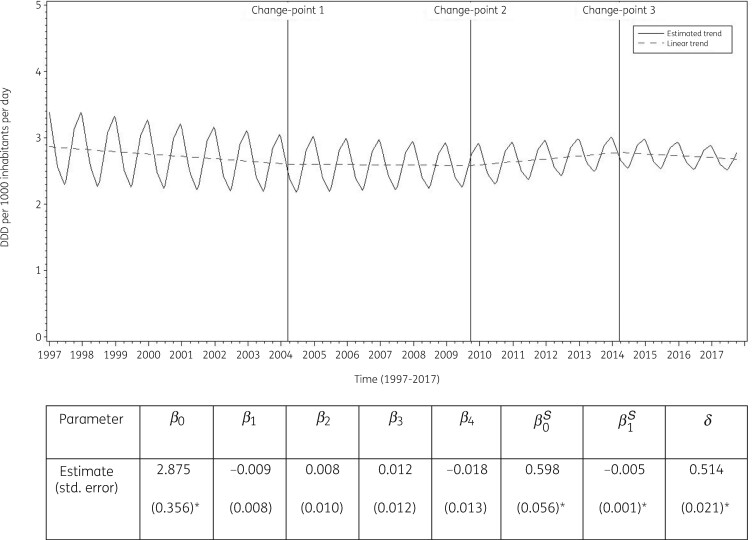
Figure 3.
Estimated trend (solid line) and linear trend (dashed line) of consumption of tetracyclines (ATC J01A) in the community based on quarterly data, 25 EU/EEA countries, 1997–2017. β0, predicted consumption in the first quarter of 1997; β1, predicted increase (if positive)/decrease (if negative) in consumption per quarter; β2, predicted difference in slope after versus before the first change-point; β3, predicted difference in slope after versus before the second change-point; β4, predicted difference in slope after versus before the third change-point; β0S, predicted amplitude of the upward winter and downward summer peak in consumption; β1S, predicted increase (if positive)/decrease (if negative) of the amplitude of the upward winter and downward summer peak in consumption per quarter; δ, shift in timing of the upward winter and downward summer peak from one year to another. An asterisk indicates the result was statistically significant at significance level 0.05.

