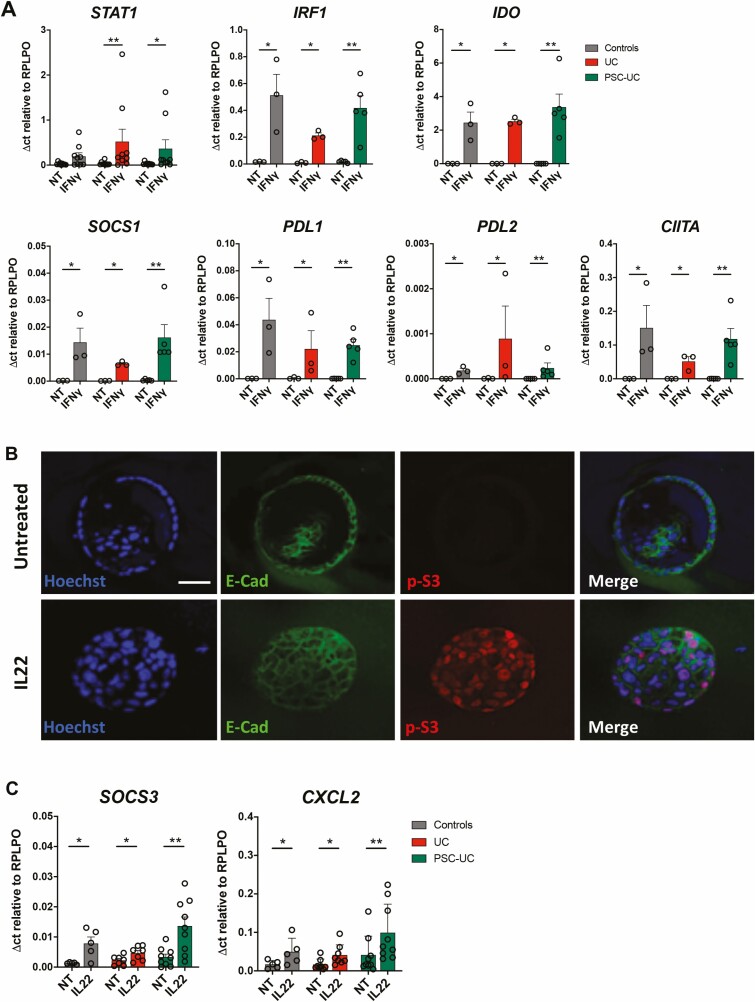
FIGURE 3.
EpOCs respond to stimulation with cytokines. A, mRNA expression of STAT1, IRF1, IDO, SOCS1, PDL1, PDL2, and CIITA in EpOCs from control patients (grey bars), patients with UC (red bars), and patients with PSC-UC (green bars), with no treatment (NT) and after 24 hours of stimulation with IFNγ (10 ng/mL). B, Immunofluorescent staining, with nuclei in blue, E-cadherin in green, and phospho-STAT3 (p-S3) in red in EpOCs untreated and stimulated with IL-22 for 15 minutes. Scale bar 100 μm. C, mRNA expression of SOCS3 and CXCL2 in EpOCs from control patients (grey bars), patients with UC (red bars), and patients with PSC-UC (green bars), with no treatment (NT) and after 24 hours of stimulation with IL-22 (10 ng/mL). Ordinary 1-way analysis of variance (Tukey test as recommended) was performed in the cytokine stimulation experiments. *P < 0.05, **P < 0.005. Error bars represent standard error of the mean.

