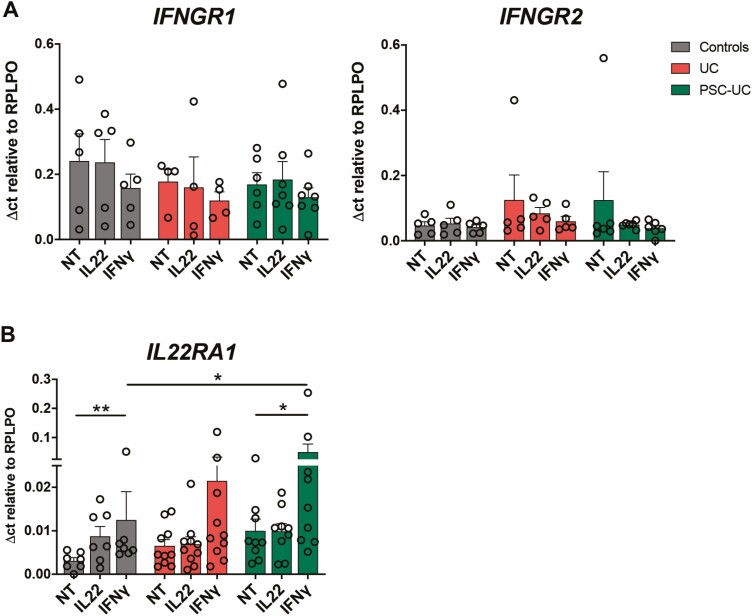
FIGURE 5.
IFNγ stimulation inducing IL-22 responsiveness in EpOCs. mRNA expression of (A) IFNGR1 and IFNGR2 and (B) IL22RA1 in EpOCs from control patients (grey bars), patients with UC (red bars), and patients with PSC-UC (green bars), with no treatment (NT) and after 24 hours of stimulation with IL-22 and IFNγ (10 ng/mL). *P < 0.05, **P < 0.00. Error bars represent standard error of the mean.

