
Figure 3. Changes in Racial and Ethnic Disparities in Coverage, Access, and Health Around the Medicare Eligibility Age Pre-ACA vs Post-ACA.
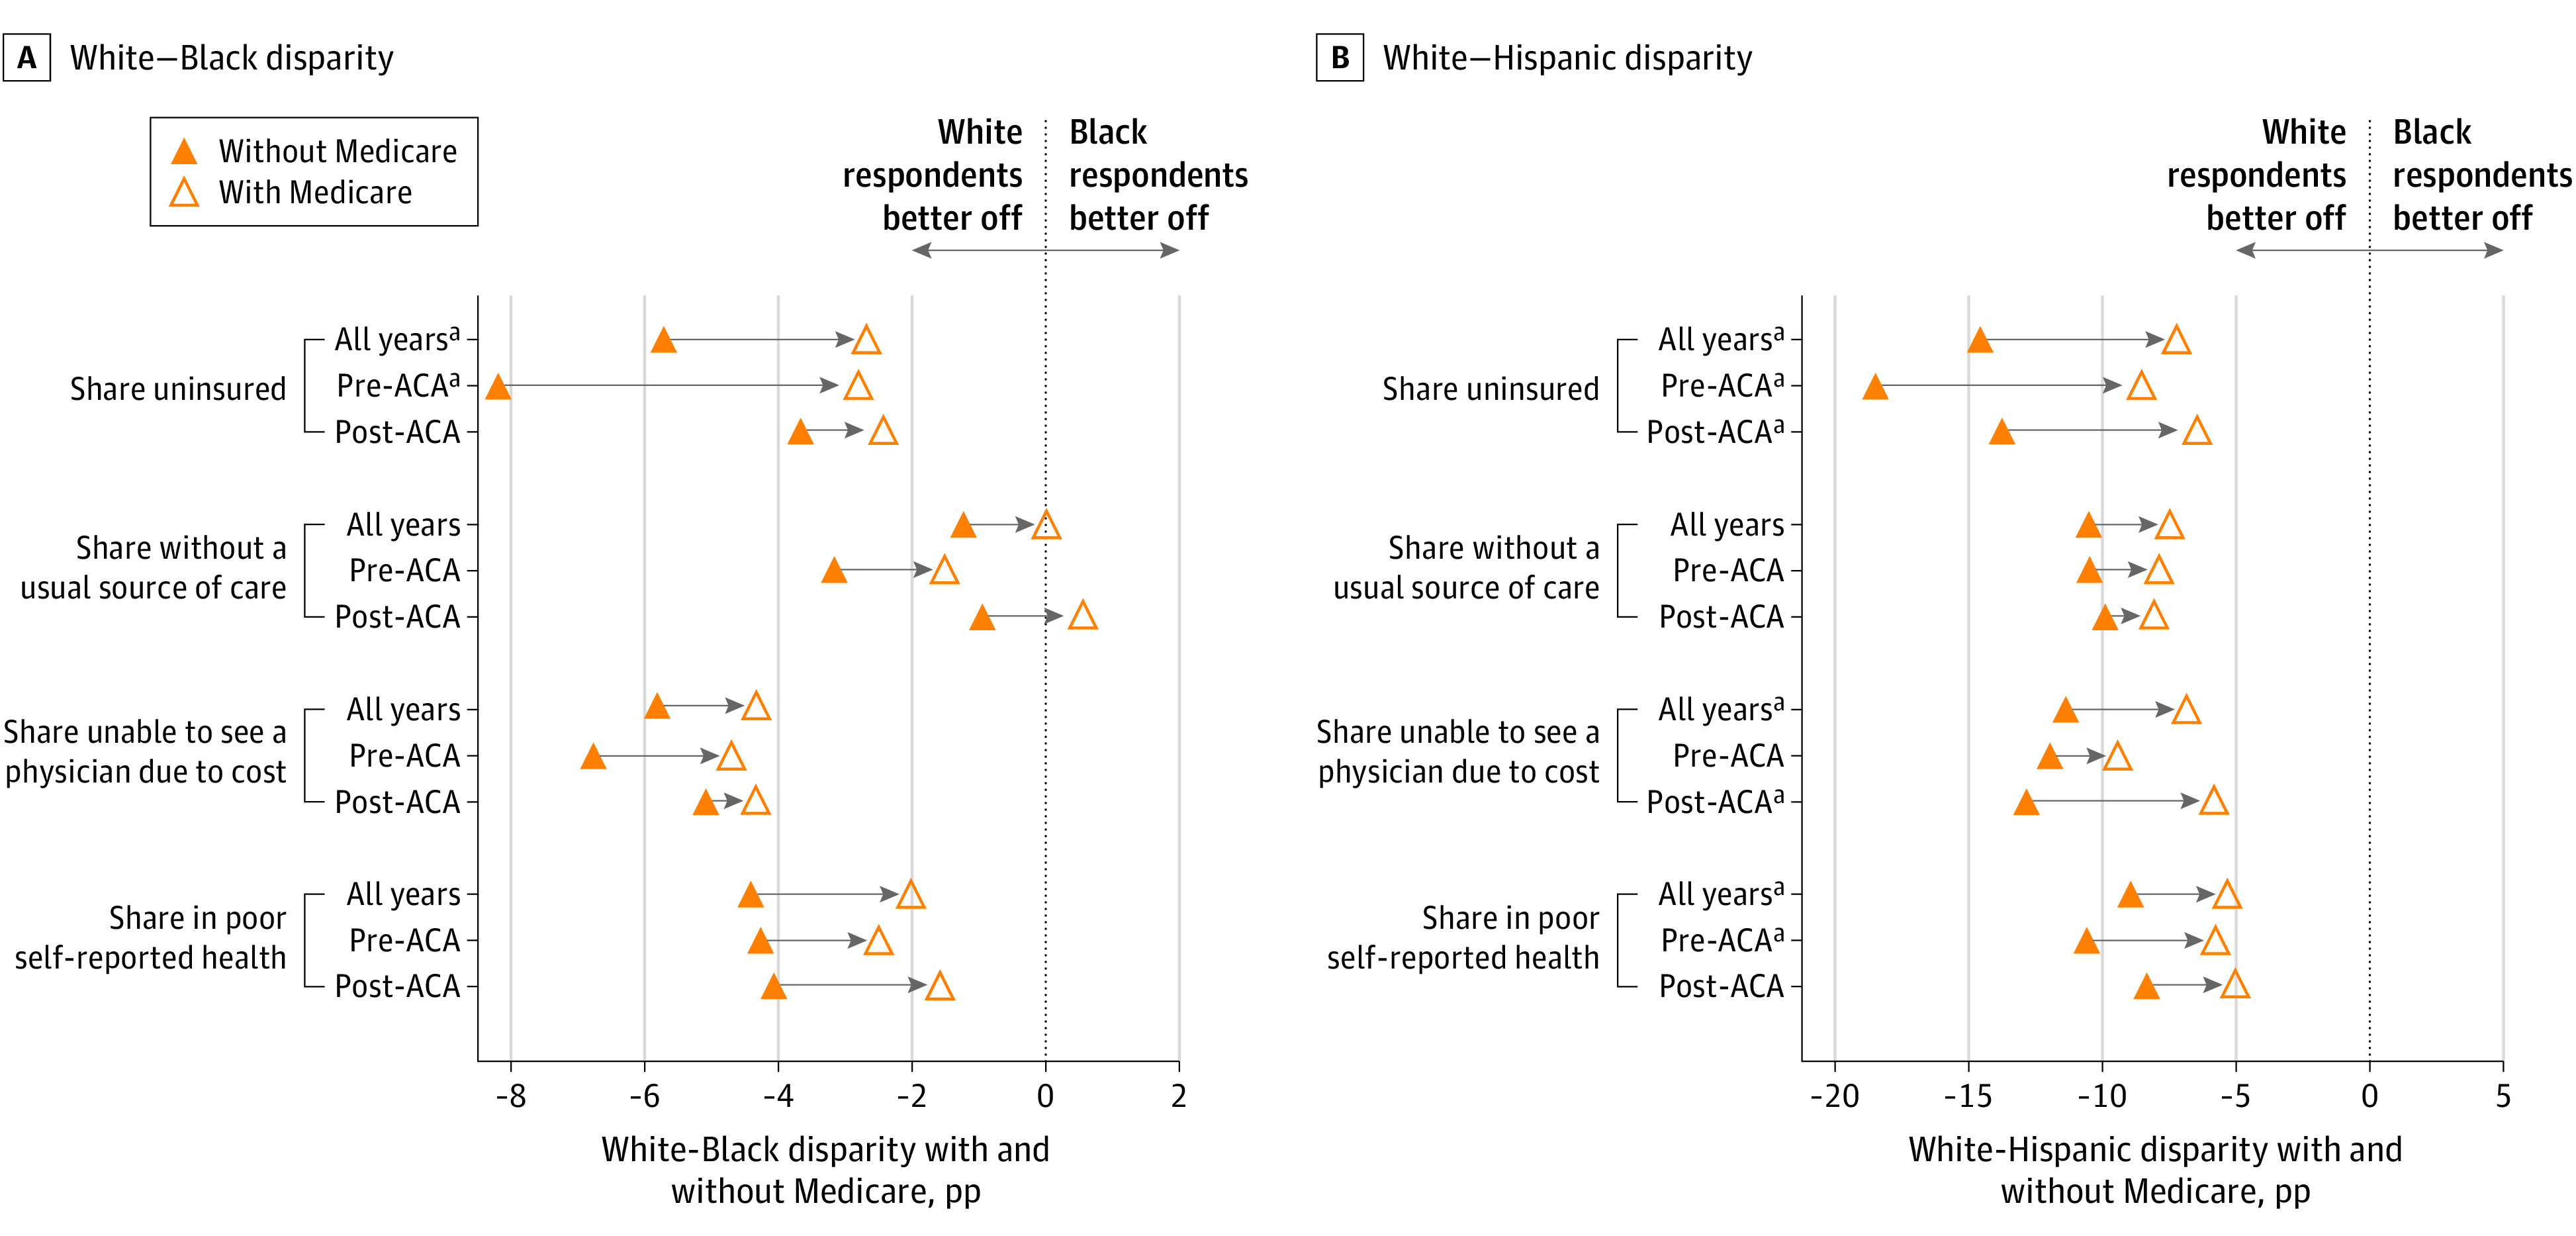
For each outcome, regression discontinuity estimates the adjusted disparities for individuals age 65 years right before Medicare eligibility (in solid triangles) and right after Medicare eligibility (in open triangles) before and after the implementation of the US Affordable Care Act (ACA). The black vertical dotted line is the 0 disparity line; to the left a comparison of the mean outcome for White respondents and racial and ethnic minority groups indicates that White respondents are better off. Panel A shows how the disparity between White and Black respondents changes at age 65 years; panel B shows how the disparity between White and Hispanic respondents changed at age 65 years; and pp indicates percentage points.
aAdjusted discontinuity in the disparity (the difference between the 2 points) is statistically significant at the 5% level.