FIGURE 3.
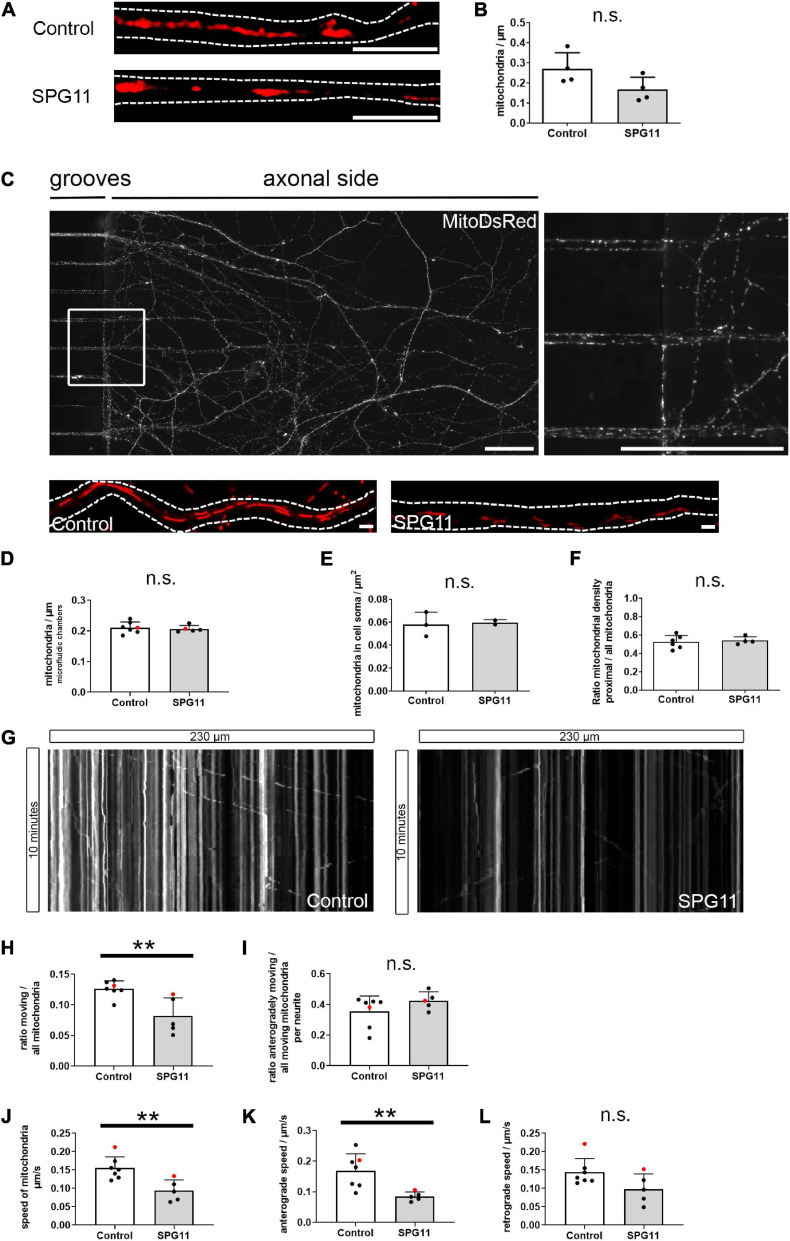
Mitochondrial density and mitochondrial axonal transport in SPG11. (A) Neurites of MNs were stained with Mitotracker. Dotted lines indicate neurite outlines. (B) Mitochondrial density was determined upon quantification of mitochondria related to neuritic length (n = 4 control and 4 SPG11 lines). (C) Representative micrograph of MNs grown in microfluidic chambers, extending from grooves into the axonal side. Magnification of the boxed area is shown on the right side. (D) Quantification of the density of mitochondria within the axonal grooves of microfluidic chambers (n = 7 control and 5 SPG11 lines; HUES6 lines marked red). (E) Quantification of the density of mitochondria within the soma of MN cultures (n = 3 control and 2 SPG11 lines). (F) Quantification of the ratio of the number of mitochondria located within the proximal half of axons over the total number of mitochondria (n = 6 control and 4 SPG11 lines). (G) Sample kymographs of mitochondria in grooves of microfluidic chambers over 10 min. (H–L) Quantification of axonal mitochondrial transport (n = 7 control and 5 SPG11 lines for all analyses; HUES6 lines marked red). (H) Quantification of the ratio of moving mitochondria over total mitochondria per axon. (I) Quantification of the ratio of anterogradely moving mitochondria over all moving mitochondria per axon. (J) Combined analysis of the speed of all moving mitochondria in μm/s. (K) Subanalysis of the speed of anterogradely moving axonal mitochondria in μm/s. (L) Subanalysis of the speed of retrogradely moving axonal mitochondria in μm/s. ** P < 0.01, n.s. no significant change. Scale bars: (A) 5 μm; (C) 50 μm (upper images), 1 μm (lower images).

