Fig. 1.

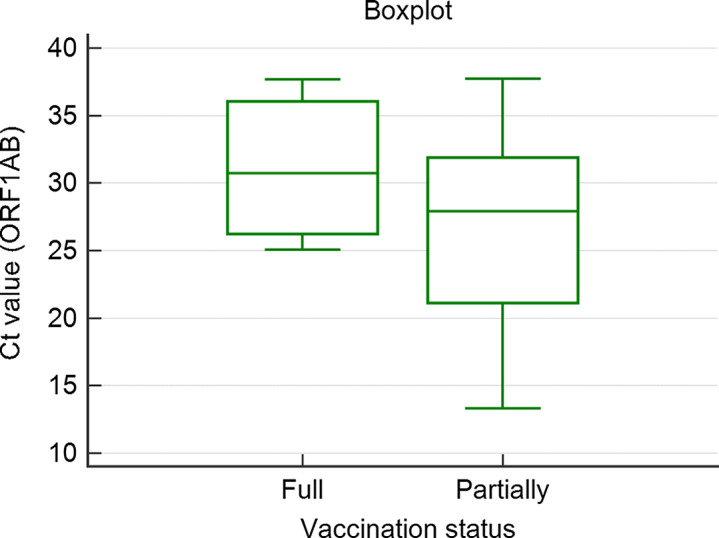
Boxplot showing the distribution of cycle threshold (Ct) values of the ORF1AB gene. ‘Partially’ on the right shows the data of the nonvaccinated and incompletely vaccinated group, ‘Full’ on the left shows data for the fully vaccinated group.

Boxplot showing the distribution of cycle threshold (Ct) values of the ORF1AB gene. ‘Partially’ on the right shows the data of the nonvaccinated and incompletely vaccinated group, ‘Full’ on the left shows data for the fully vaccinated group.