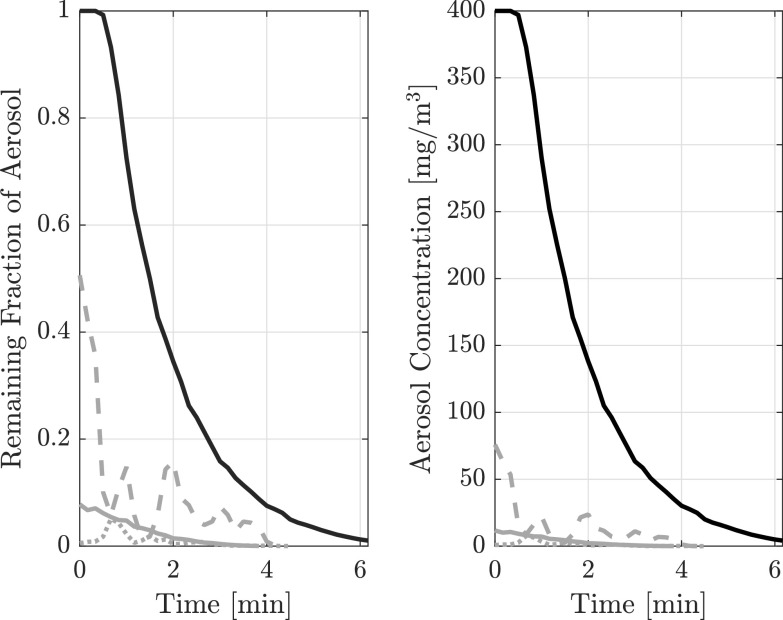
Fig. 3.
Comparing different interventions at the nurses’ station on aerosol clearance and transmission of aerosols. Left image shows the values normalized to the saturation value of the sensor whereas right shows the measured value. The measurements were taken with 2 air cleaners in the patient room. Note. The black solid line indicates measures taken within the patient room. The grey solid line indicates measures taken at the nurses’ station (NS) with Zipwall present. The grey dashed line indicates measures taken at NS without barrier. The grey dotted line indicates measures taken at NS with air cleaner barrier present (3 air cleaners in front of desk).

