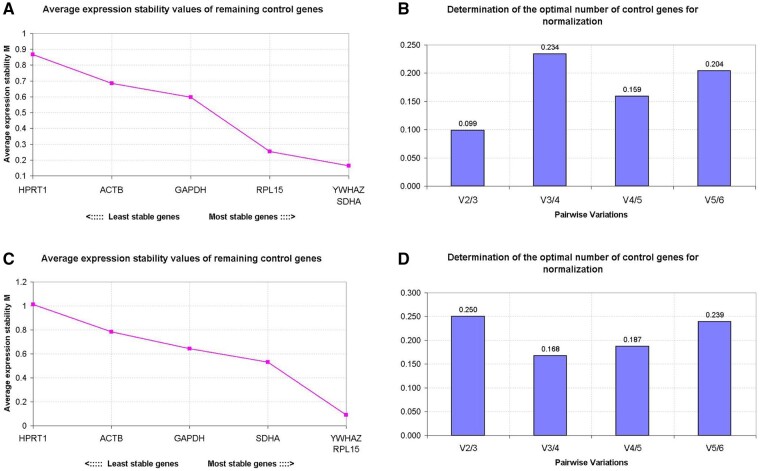
Figure 5.
Reference gene selection in morulae and blastocysts. The geNorm analysis of the average expression stability (M value) of all candidate reference genes determined by quantitative RT-PCR; cDNA samples were synthesised using random primers (A) or oligo(dT) primers (C). More stable reference genes are positioned on the right side of the diagram, with less stable genes on the left side. The optimal number of reference genes for normalisation was determined by Pairwise variation (V) between the normalisation factors (Vn and Vn + 1). The optimal number of reference genes is shown for cDNA samples synthesised with random primers (B) or oligo(dT) primers (D). Y-axis represents the v-value indicating the pairwise variation between two sequential normalisation factors. Samples were collected from pools of 50 embryos with three biological replicates.

