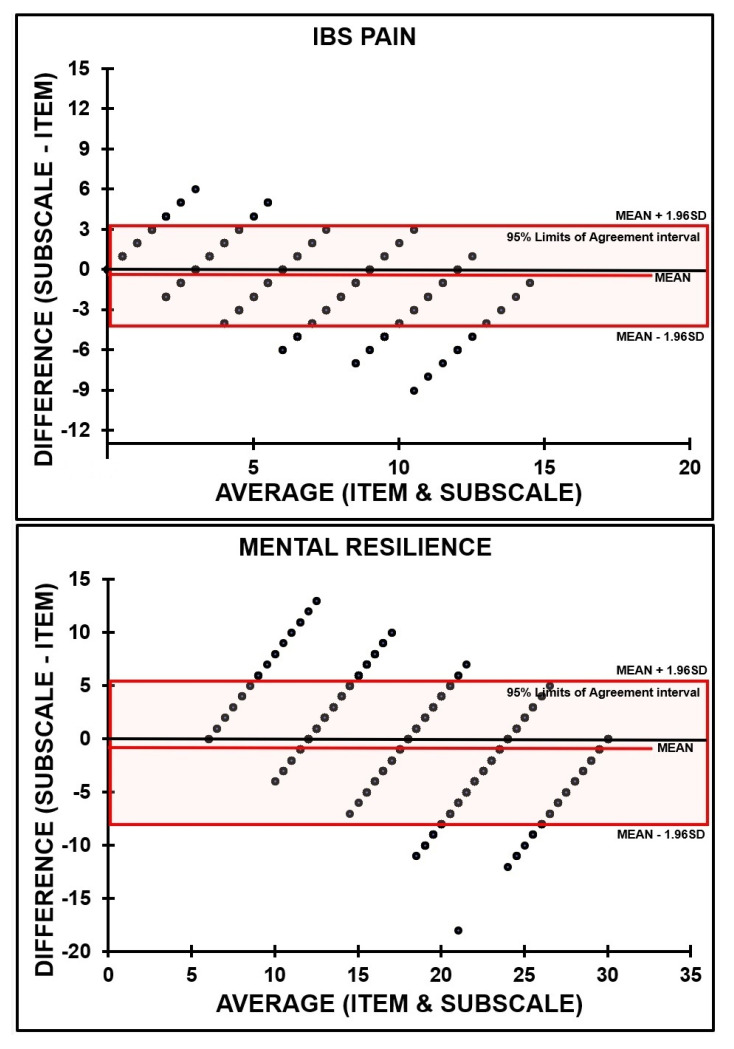
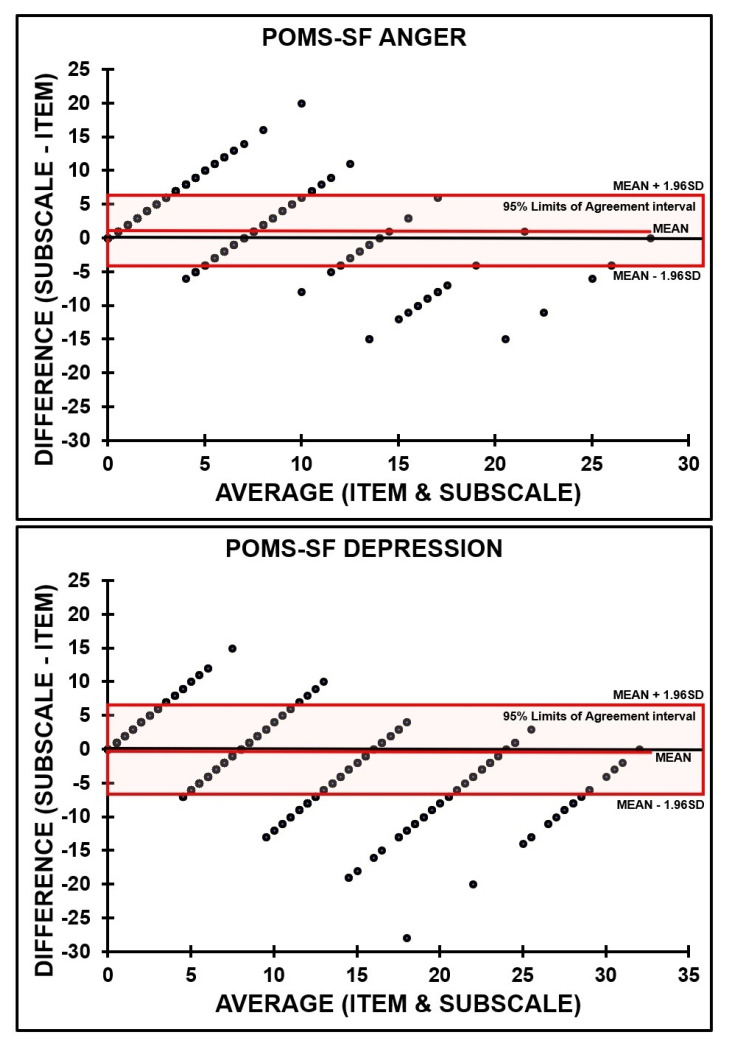
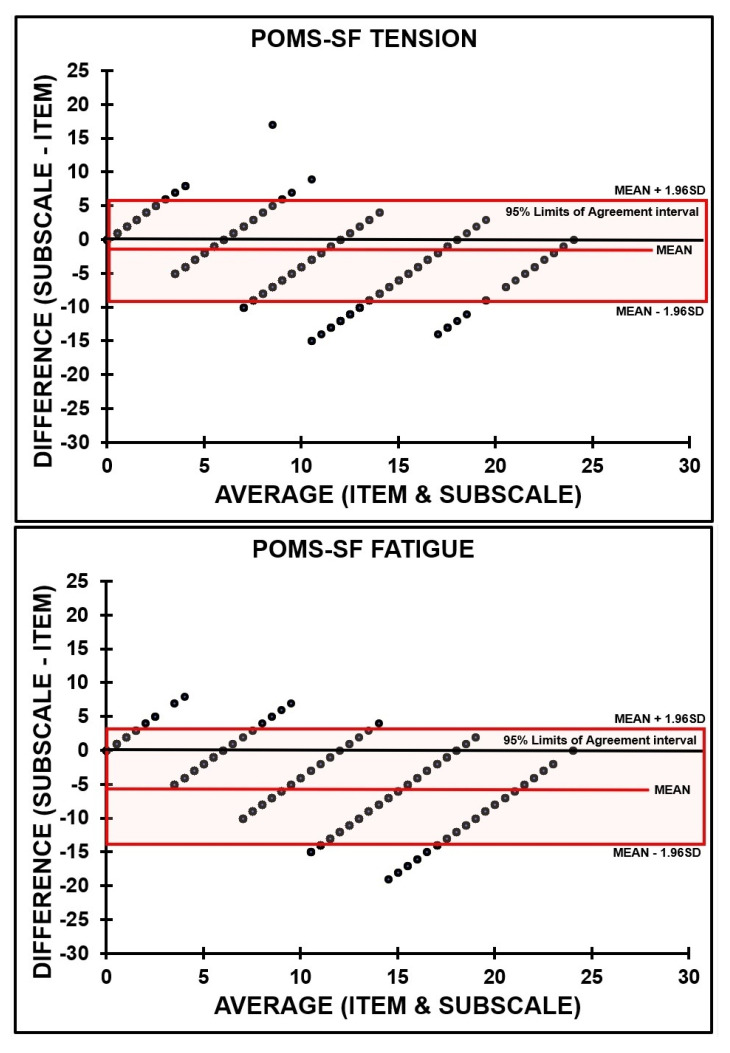
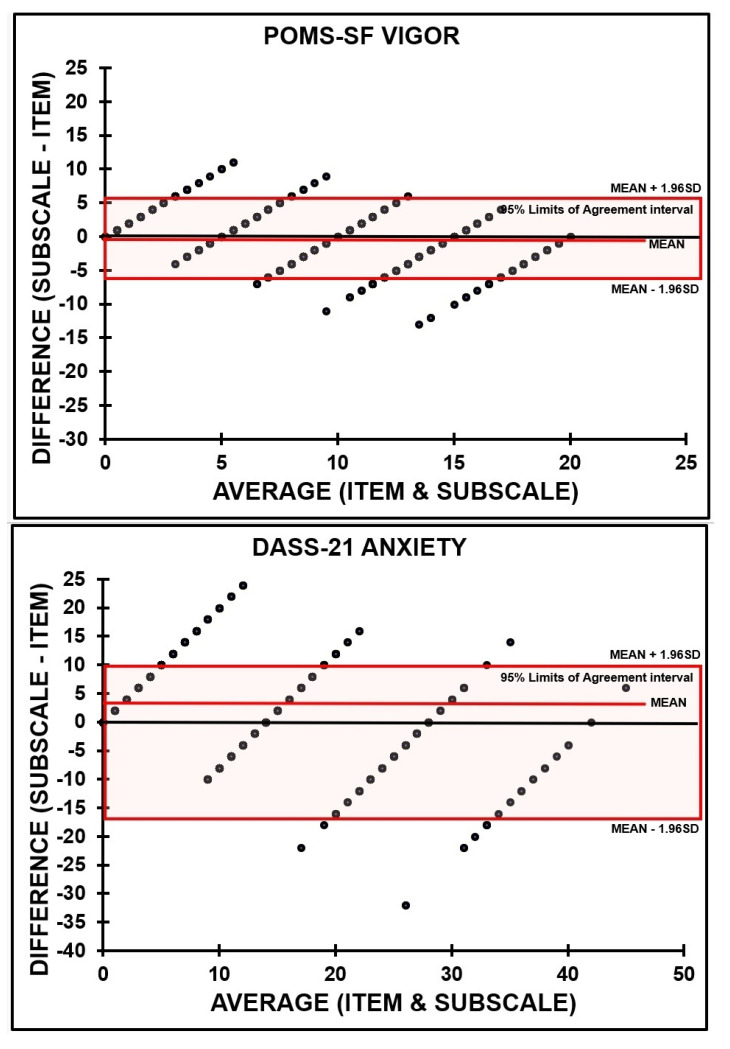
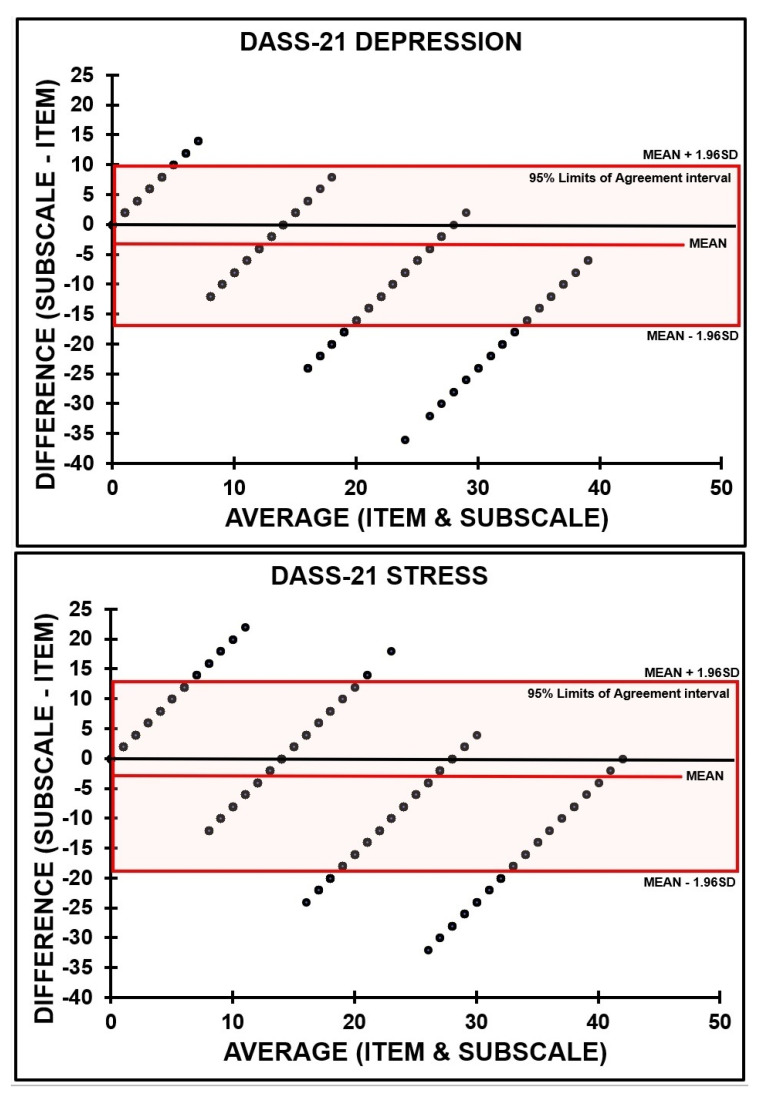
Figure 2.
Bland and Altman plots are shown for the irritable bowel syndrome (IBS) subscales constipation, diarrhea, and pain; for mental resilience; for the profiles of mood scales–short form (POMS-SF) subscales anger, depression, tension, fatigue, and vigor; and for the DASS-21 subscales depression, anxiety, and stress. The mean difference (red color line) and 95% limits of agreement (red box) are indicated. Values on the y-axis are the difference between the single-item assessments (multiplied by the number of subscale items) and subscale assessments for each subject against the mean score of the two assessments. Values on the x-axis are the average score of the single-item rating and the subscale.

