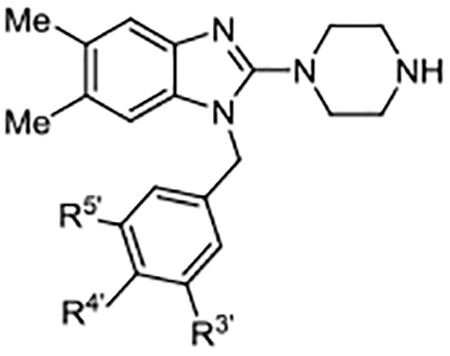
Table 2.
Benzyl Substituents
 |
|||||
|---|---|---|---|---|---|
| Compd | R3’ | R4’ | R5’ | EC50 (μM) | Act. (%)a |
| 10 | Cl | F | H | 2.2 ± 0.52 | 211 ± 20.5 |
| 12 | H | H | H | 8.6 ± 1.64 | 122 ± 17.8 |
| 13 | H | F | H | 5.9 ± 4.88 | 130 ± 28.1 |
| 14 | H | Cl | H | 12.4 ± 2.70 | 164 ± 15.0 |
| 15 | H | Me | H | 36.6 ± 17.26 | 93 ± 13.0 |
| 16 | H | CF3 | H | 19.6 ± 5.01 | 148 ± 30.7 |
| 17 | F | F | H | 5.9 ± 1.33 | 183 ± 25.3 |
| 18 | Me | F | H | 4.1 ± 2.00 | 190 ± 20.6 |
| 19 | CF3 | F | H | 8.1 ± 0.52 | 263 ± 52.5 |
| 20 |  |
F | H | 11.7 ± 2.74 | 151 ± 5.0 |
| 21 | Me | F | Me | 3.7 ± 0.29 | 270 ± 73.8 |
Measurements are reported as the mean ± SD of two or more independent experiments, each conducted in duplicate.
Activation values represent percentage relative to control.25
