
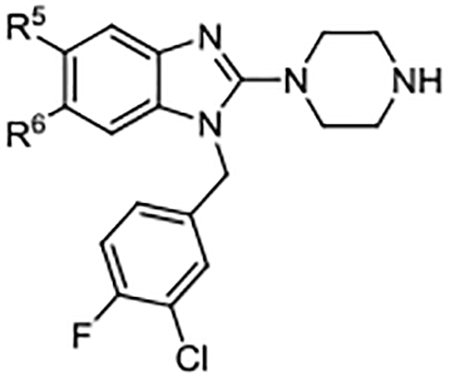
Table 3.
5,6-Substituents
 |
||||
|---|---|---|---|---|
| Compd | R5 | R6 | EC50 (μM) | Act. (%)a |
| 10 | Me | Me | 2.2 ± 0.52 | 211 ± 20.5 |
| 22 | Me | Cl | 3.0 ± 0.56 | 200 ± 13.3 |
| 23 | H | H | 5.4 ± 1.22 | 109 ± 4.2 |
| 24 | H | Me | 2.4 ± 0.33 | 106 ± 13.1 |
| 25 | H | CF3 | 4.4 ± 0.54 | 78 ± 2.2 |
| 26 | H |  |
24.3 ± 5.33 | 65 ± 2.2 |
| 27 | H | Br | 1.3 ± 0.3 | 115 ± 5.4 |
| 28 | H | Cl | 1.0 ± 0.16 | 109 ± 1.0 |
Measurements are reported as the mean ± SD of two or more independent experiments, each conducted in duplicate.
a
Activation values represent percentage relative to control.25