
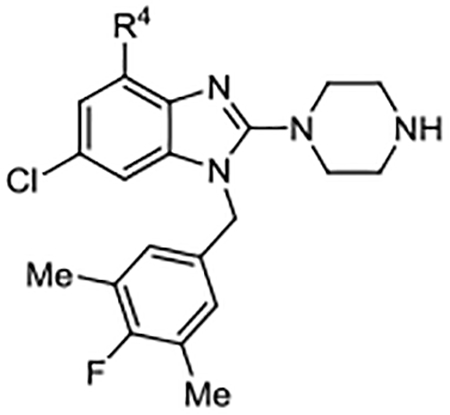
Table 4.
C-4 SAR
 |
||||||||||||||
|---|---|---|---|---|---|---|---|---|---|---|---|---|---|---|
| Compd | R4 | Kd (μM)a | AlogP | LipE | Compd | R4 | Kd (μM)b | AlogP | LipE | Compd | R4 | Kd (μM)b | AlogP | LipE |
| 29 | H | 0.46 ± 0.078 | 5.10 | 1.23 | 39 | 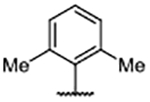 |
0.30 ± 0.078 | 7.59 | −1.06 | 49 | 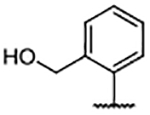 |
0.14 ± 0.009 | 6.02 | 0.85 |
| 30 | 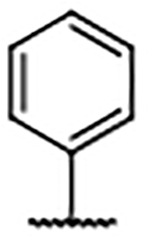 |
0.27 ± 0.005 | 6.62 | −0.06 | 40 |  |
0.20 ± 0.003 | 6.18 | 0.51 | 50 |  |
0.24 ± 0.056 | 5.47 | 1.16 |
| 31 |  |
0.21 ± 0.010b | 7.11 | −0.44 | 41 |  |
0.13 ± 0.030 | 4.95 | 1.95 | 51 |  |
0.33 ± 0.027a | 5.47 | 1.01 |
| 32 |  |
0.21 ± 0.029 | 7.56 | −0.88 | 42 |  |
0.14 ± 0.013 | 5.22 | 1.65 | 52 |  |
0.45 ± 0.104 | 5.43 | 0.92 |
| 33 |  |
0.39 ± 0.093 | 7.82 | −1.41 | 43 |  |
0.25 ± 0.057a | 5.14 | 1.46 | 53 |  |
0.39 ± 0.064 | 4.75 | 1.66 |
| 34 |  |
0.44 ± 0.139 | 7.90 | −1.54 | 44 |  |
0.24 ± 0.083a | 4.41 | 2.21 | 54 |  |
0.35 ± 0.001 | 4.84 | 1.61 |
| 35 |  |
0.15 ± 0.048 | 7.56 | −0.74 | 45 |  |
0.31 ± 0.083 | 5.22 | 1.30 | 55 |  |
0.11 ± 0.018 | 5.12 | 1.82 |
| 36 |  |
0.67 ± 0.007 | 7.56 | −1.39 | 46 |  |
0.38 ± 0.025 | 5.22 | 1.20 | 56 |  |
0.10 ± 0.011 | 6.25 | 0.74 |
| 37 |  |
1.05 ± 0.056 | 7.56 | −1.59 | 47 |  |
0.14 ± 0.009 | 4.93 | 1.92 | 57 |  |
0.18 ± 0.081 | 5.06 | 1.68 |
| 38 |  |
0.12 ± 0.034 | 7.29 | −0.43 | 48 |  |
0.24 ± 0.036 | 4.93 | 1.69 | 58 |  |
<0.10 | 5.49 | --c |
Measurements are reported as the mean ± SD of two or more independent experiments, each conducted in duplicate.
a
Evaluated through displacement of probe S1 (Supplementary Figure S2).
b
Evaluated through displacement of probe S2 (Supplementary Figure S2).
c
LipE was not determined.