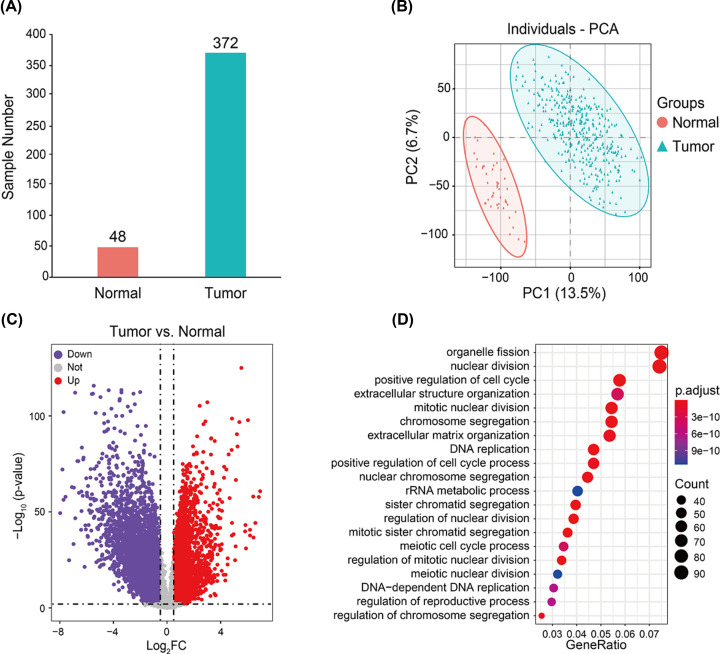
Figure 2. Identification of DEGs between 48 normal and 372 CRC samples.
(A) Principal component analysis. (B) Volcano plot. Purple dots represent genes down-regulated in CRC; gray dots, genes not differing significantly between CRC and normal tissues; and red dots, genes up-regulated in CRC. (C) The volcano plot. Purple dots represent down-regulated genes, gray dots represent not significant genes, and red dots represent up-regulated genes. (D) GO analysis of functional enrichment of up-regulated genes. Dot size reflects the number of genes enriched under the given ontology term, and the color indicates the significance of enrichment.

