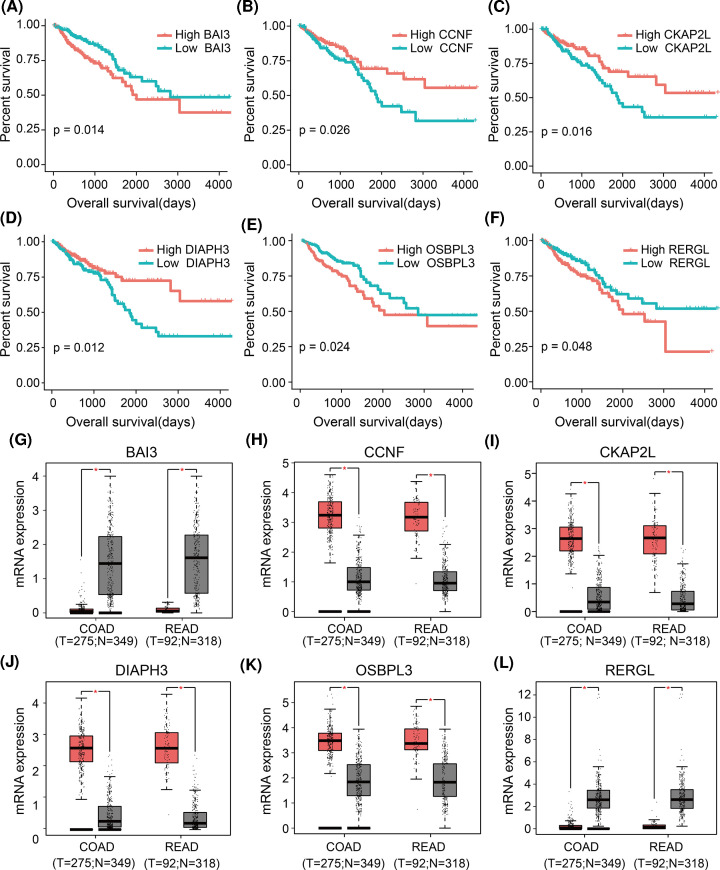
Figure 4. Survival analysis and validation of six hub genes using an independent dataset.
(A–F) Kaplan–Meier survival curves of CRC patients stratified by low or high expression of the six hub genes. (G–L) Differences in expression of the six hub genes between normal and tumor tissues in the GEPIA database. *P<0.01.

