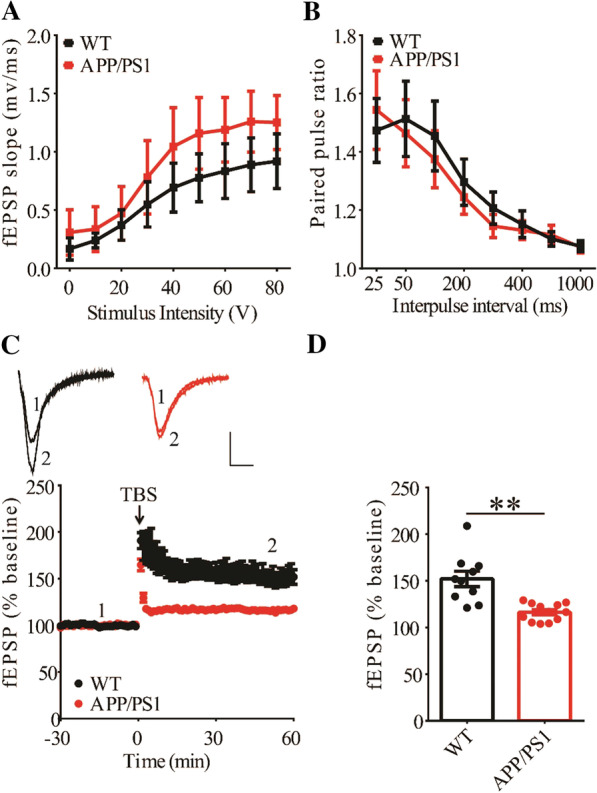
Fig. 2.

Impaired LTP in 3-month old APP/PS1 mice. A Input–output curves of fEPSP showing no differences between WT and APP/PS1 mice (WT n = 4 slices from 4 mice, APP/PS1 n = 6 slices from 4 mice; genotype, group: F(1,3) = 1.210, p = 0.352; stimulus intensity: F(8,24) = 29.777, p < 0.001; repeated two-way ANOVA). B Paired pulse ratio showing no differences between WT and APP/PS1 mice (WT n = 6 slices from 4 mice, APP/PS1 n = 6 slices from 4 mice; genotype: F(1,5) = 0.013, p = 0.913; inter-pulse interval: F(7,35) = 18.961, p < 0.001; repeated two-way ANOVA). C TBS induced LTP at the CA1 synapse in WT, but not in APP/PS1 mice. Scale bars: 0.2 mV/10 ms. D Summary graph showing no LTP in APP/PS1 compared to WT mice (WT n = 10 slices from 6 mice, APP/PS1 n = 12 slices from 7 mice, p = 0.002, two-tailed t-test). Data are presented as mean ± s.e.m. fEPSP sample traces in this and other figures were average of 6 individual responses. **p < 0.01, ns = not significant
