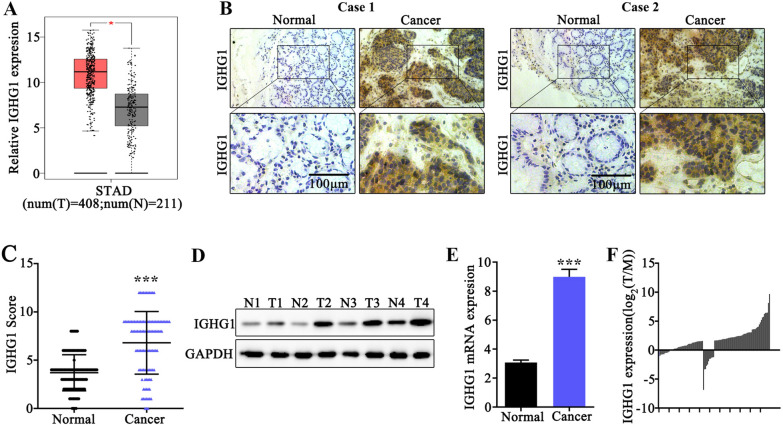
Fig. 1.
IGHG1 expression level was significantly elevated in gastric cancer samples. A Quantification and comparison of IGHG1 mRNA expression level in gastric cancer tumor samples and matched adjacent normal tissues utilizing data from public bioinformatic database (GEPIA); B Immunohistochemical (IHC) imaging of IGHG1 expression differences between clinical samples of gastric cancer tissue and normal gastric tissues from two typical clinical cases; C IHC imaging scores of IGHG1 expression between sample groups of gastric cancer and normal control gastric tissues; D Western Blot analysis of IGHG1 protein expression level in 4 pairs of clinical gastric cancer samples and matched adjacent normal tissues; E, F qRT-PCR analysis of IGHG1 mRNA expression level in clinical samples of gastric cancer and normal control tissues

