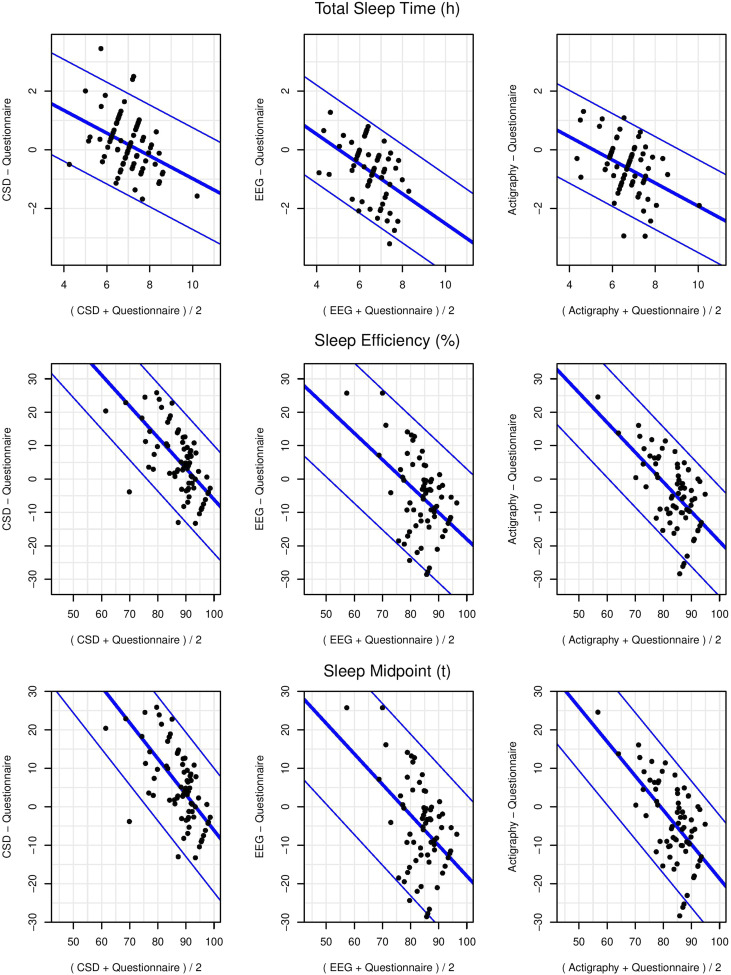
Figure 2. Bland-Altman plots for averaged-across-week single-channel EEG-, actigraphy-, CSD-, and questionnaire-assessed total sleep time, sleep efficiency, and sleep midpoint with slopes allowed to vary linearly and with diagonal blue lines indicating mean bias (thicker middle line) and 95% limits of agreement (thinner outer lines).
CSD = Consensus Sleep Diary, EEG = electroencephalography.

