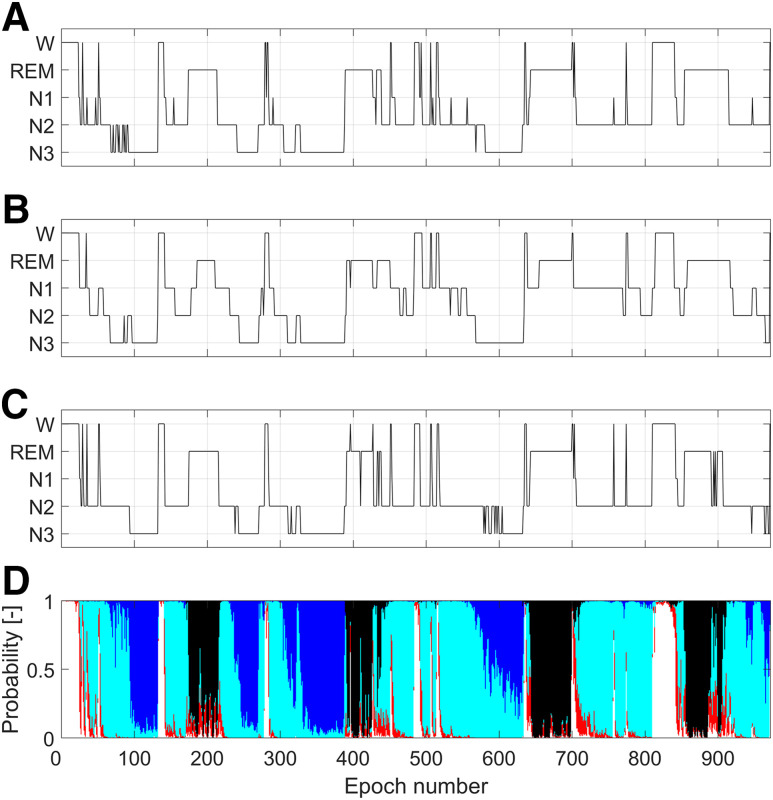
Figure 2. Visual comparison of hypnograms and hypnodensity for the same polysomnographic recording.
(A) Manual hypnogram scored in Innsbruck. (B) Manual hypnogram scored in Berlin. (C) Hypnogram obtained by applying the automatic Stanford-STAGES algorithm. For each epoch, the sleep stage assigned was the one having the highest probability in the hypnodensity (D). Color codes for probabilities in the hypnodensity: white, W; red, N1; light blue, N2; dark blue, N3; black, REM. W = wakefulness, REM = rapid eye movement sleep, N1 = non-REM stage 1 sleep, N2 = non-REM stage 2 sleep, N3 = non-REM stage 3 sleep.

