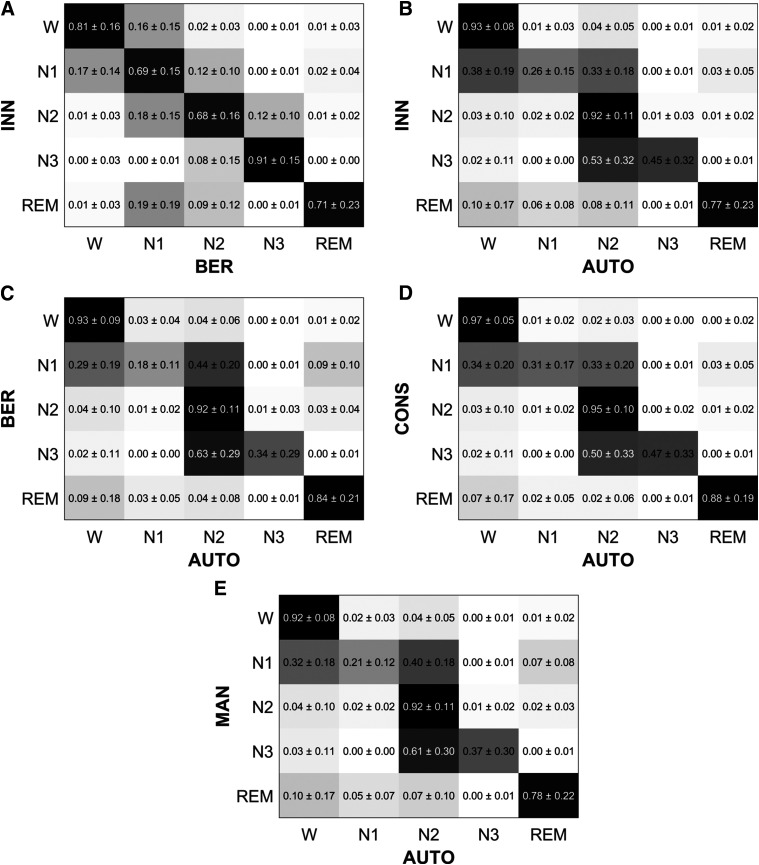
Figure 4. Row-wise normalized confusion matrices across all participants.
The values are shown as mean and standard deviation across the participants. For each matrix element, a darker color represents a higher agreement. (A) INN vs BER: comparison of manual hypnograms scored in Innsbruck and Berlin. (B) INN vs AUTO: comparison of manual hypnograms scored in Innsbruck to the automatic ones. (C) BER vs AUTO: comparison of manual hypnograms scored in Berlin to the automatic ones. (D) CONS vs AUTO: comparison of the epochs where manual scorers from Innsbruck and Berlin were in consensus to the respective epochs automatically scored. (E) MAN vs AUTO: comparison of both manual hypnograms to the automatic one (in case of disagreement between manual scorers, an epoch was equally weighted between the 2 manually scored stages). As an example to interpret these row-wise CMs, in A, the element in {row 1, column 1} indicates that 81 ± 16% of the epochs scored as W in Innsbruck were also scored as W in Berlin. Similarly, the element in {row 1, column 2} indicates that 16 ± 15% of the epochs scored as W in Innsbruck were scored as N1 in Berlin. W = wakefulness, REM = rapid eye movement sleep, N1 = non-REM stage 1 sleep, N2 = non-REM stage 2 sleep, N3 = non-REM stage 3 sleep.

