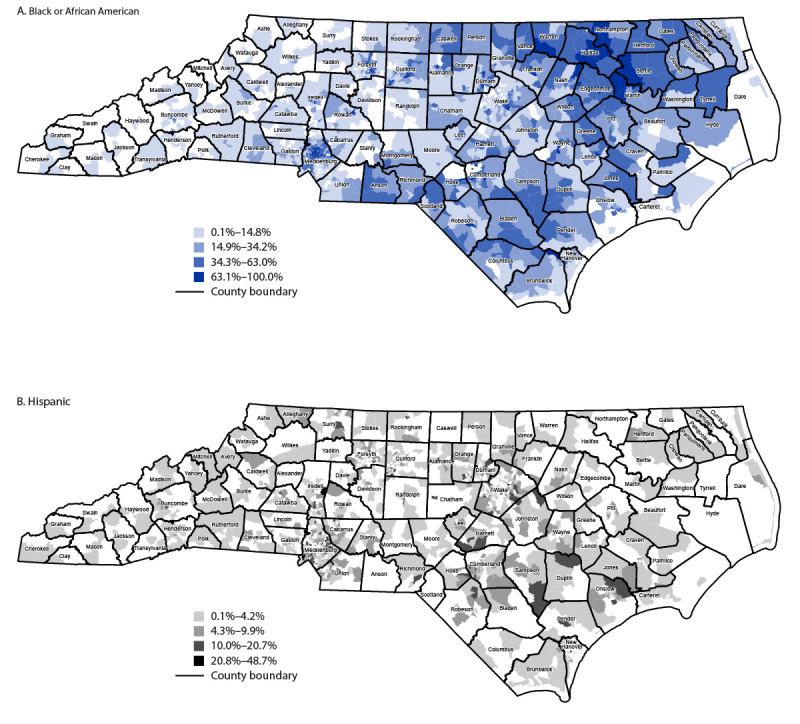
FIGURE 1.

Proportion of Black or African American (A) and Hispanic (B) persons aged ≥65 years, by U.S. Census tract* — North Carolina, 2019†
* County boundaries are approximate.
† Data from U.S. Census Bureau American Community Survey (2019 5-year estimates).
