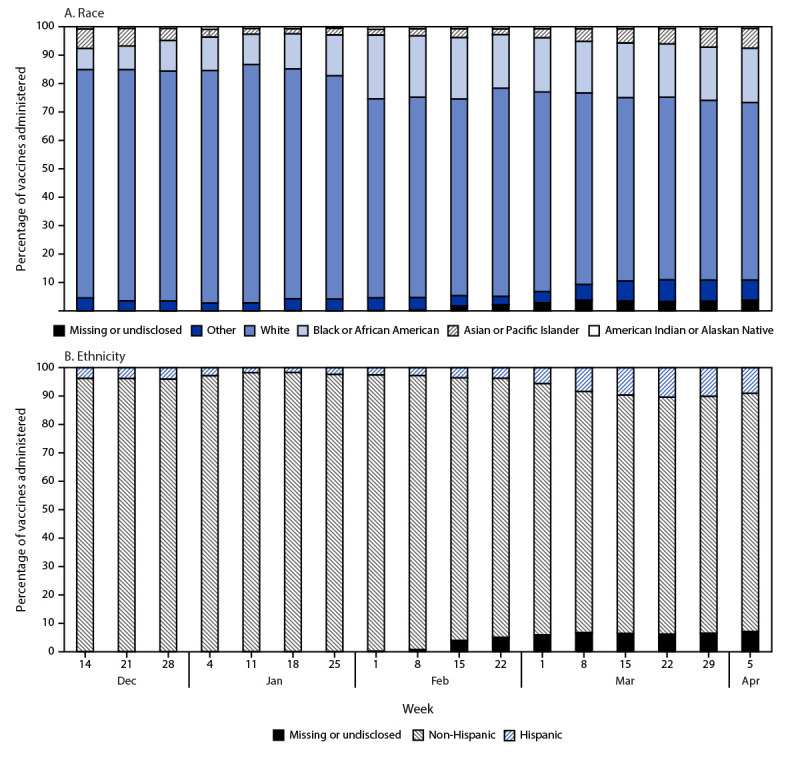
FIGURE 2.

Percentage of COVID-19 vaccine doses (n = 2,815,774) administered, by race (A) and ethnicity (B)* and week† — North Carolina, December 14, 2020–April 6, 2021
* Race and ethnicity self-reported by vaccinated persons and recorded by vaccine providers in the North Carolina COVID-19 Vaccination Management System. Data include all persons aged ≥16 years.
† “Apr 5” week was 2 days (April 5–6, 2021); all other weeks were 7 days.
