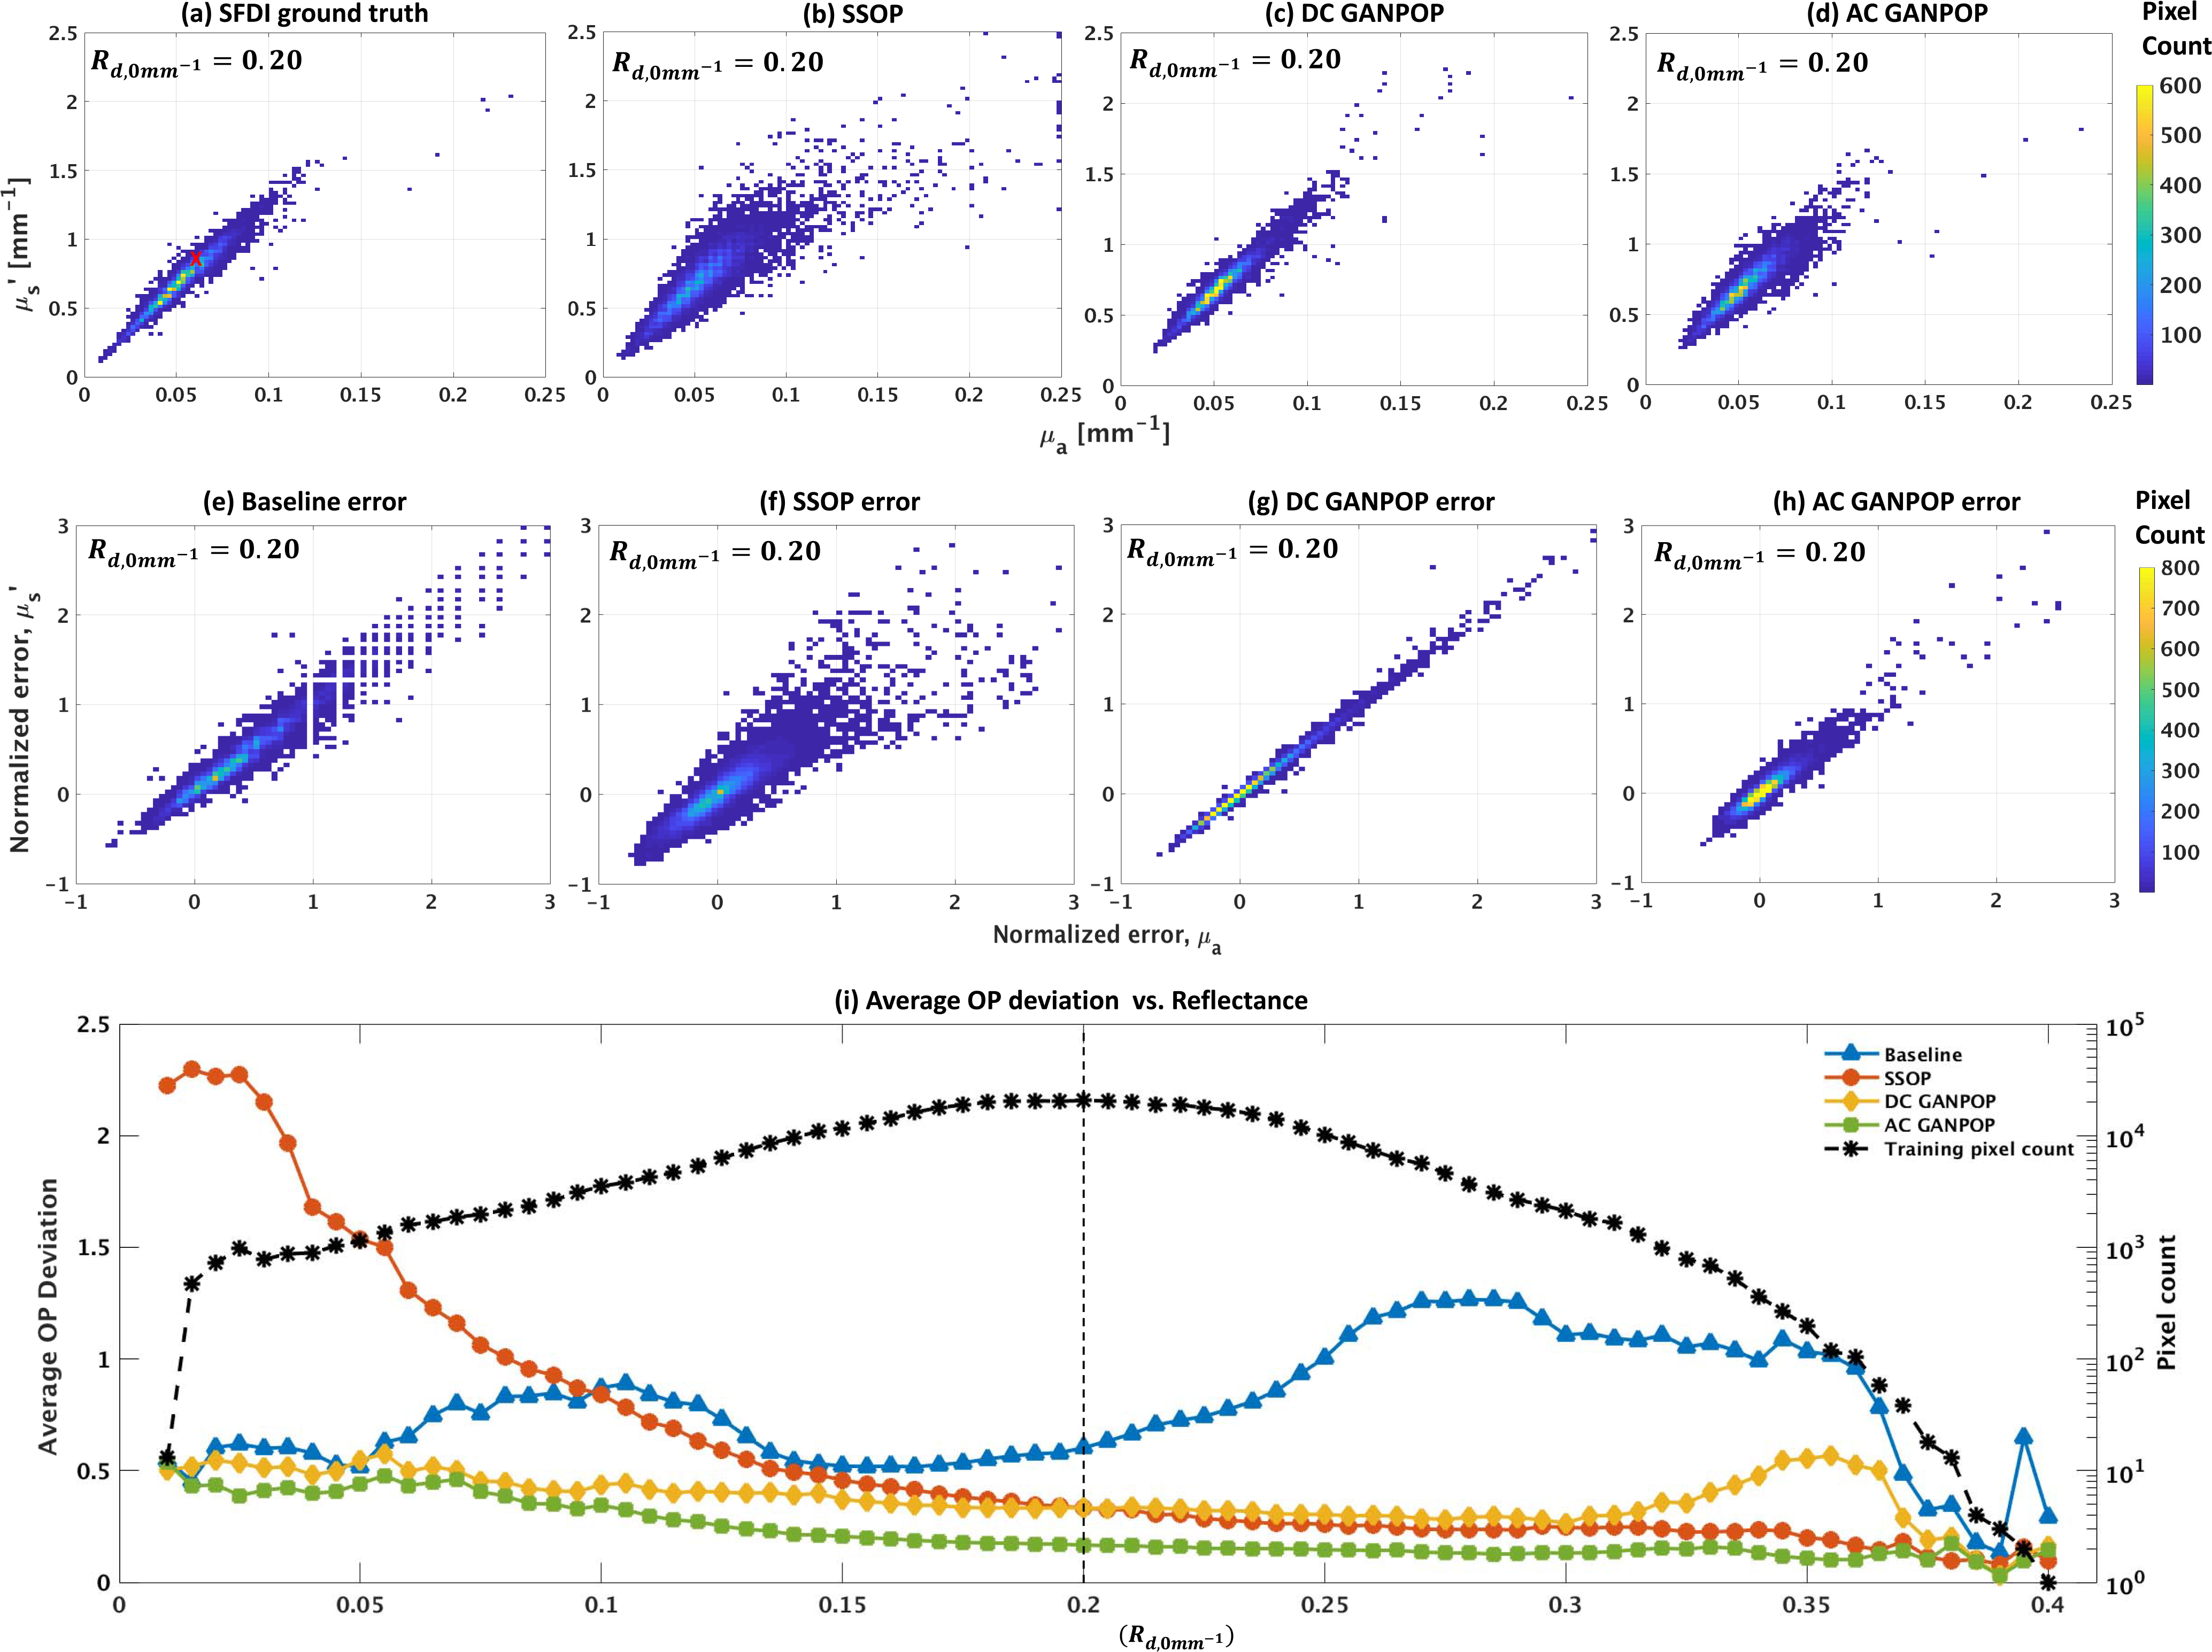
Fig. 11.

Top row: optical property distributions of esophagus test samples estimated by: (a) SFDI ground truth, (b) SSOP, (c) DC GANPOP, and (d) AC GANPOP, at a constant reflectance of . Red cross in (a) marks the baseline measurement, which is the average value of all training optical property pairs. Middle row: corresponding error histograms from (e) baseline, (f) SSOP, (g) DC GANPOP, and (h) AC GANPOP. Bottom row: (i) plot of average average optical property (OP) deviation of all optical property pairs for a given DC reflectance. Each average OP deviation is calculated as the average distance of all test points from ground truth at the corresponding reflectance level. Dotted line in (i) indicates where (a)-(h) are sampled.
