
Fig. 12.
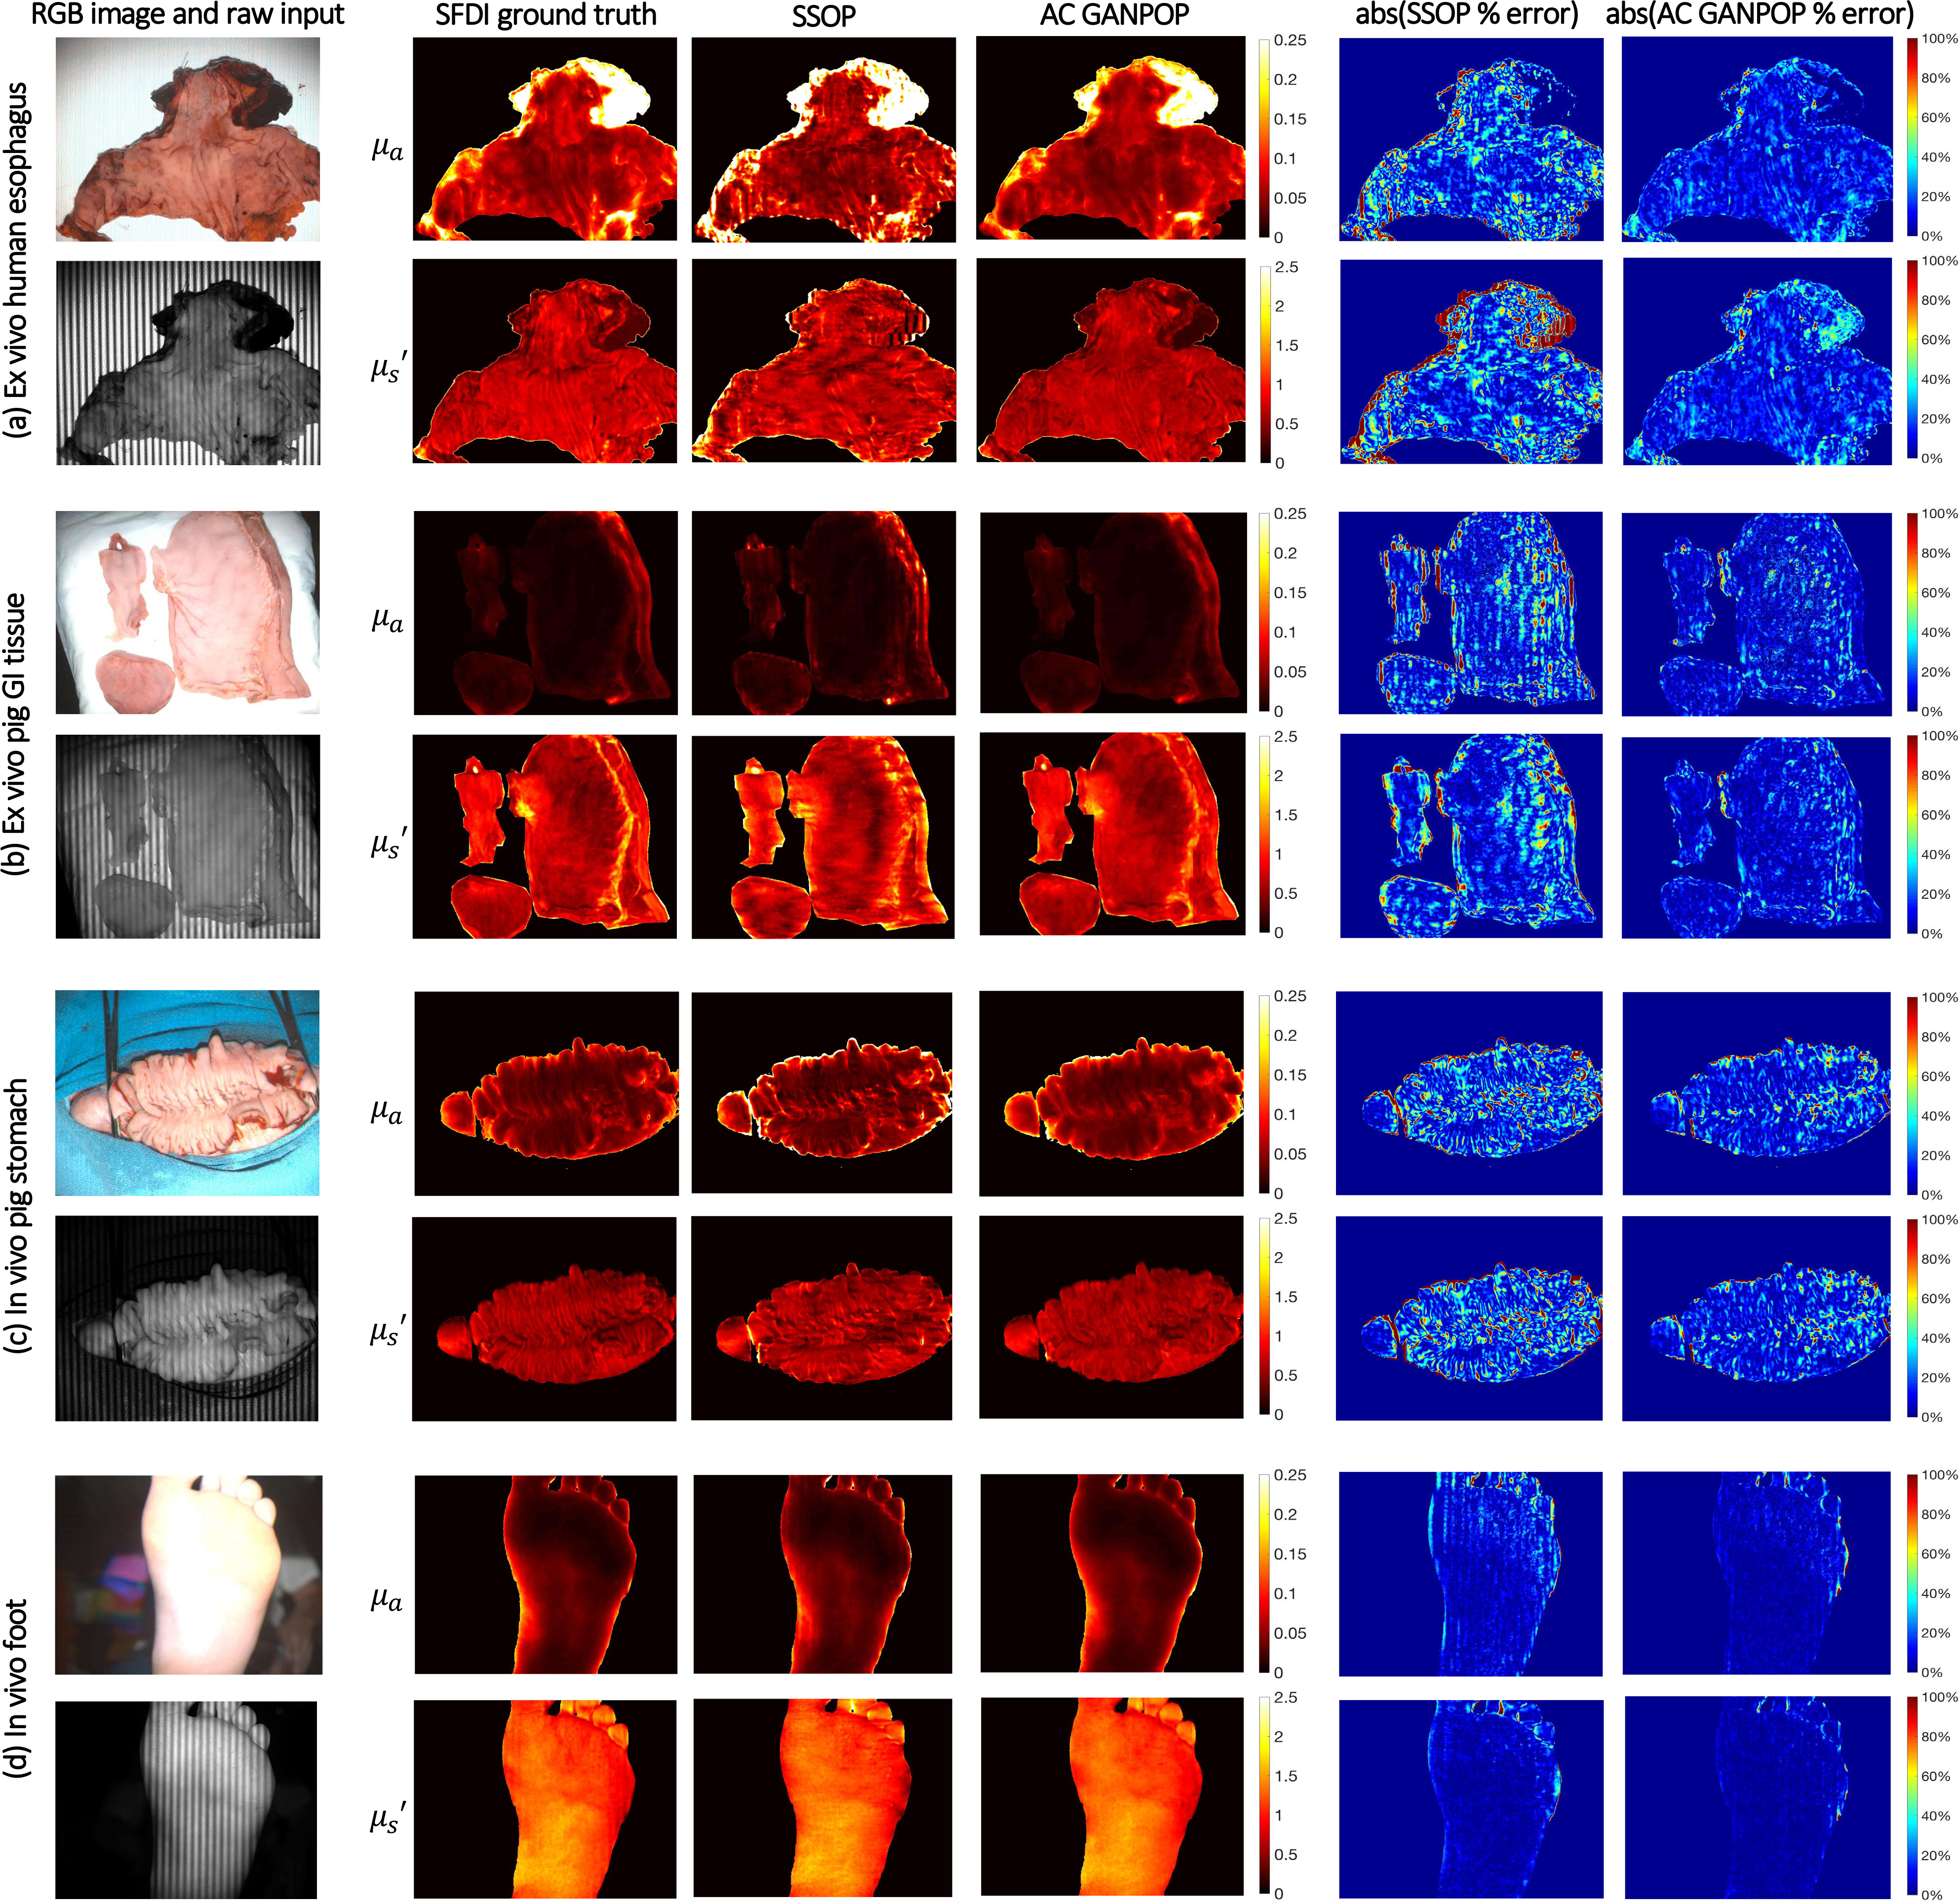
Example results for AC input to non-profilometry-corrected optical properties (N1). From left to right: RGB image and raw structured illumination image, SFDI ground truth, SSOP output, AC GANPOP output, absolute percent error map between SSOP and ground truth, and absolute percent error map between AC GANPOP and ground truth. From top to bottom: (a) ex vivo human esophagus, (b) ex vivo pig stomach and esophagus, (c) in vivo pig colon, and (d) in vivo human foot. Optical properties are measured in mm−1.