Fig. 4.

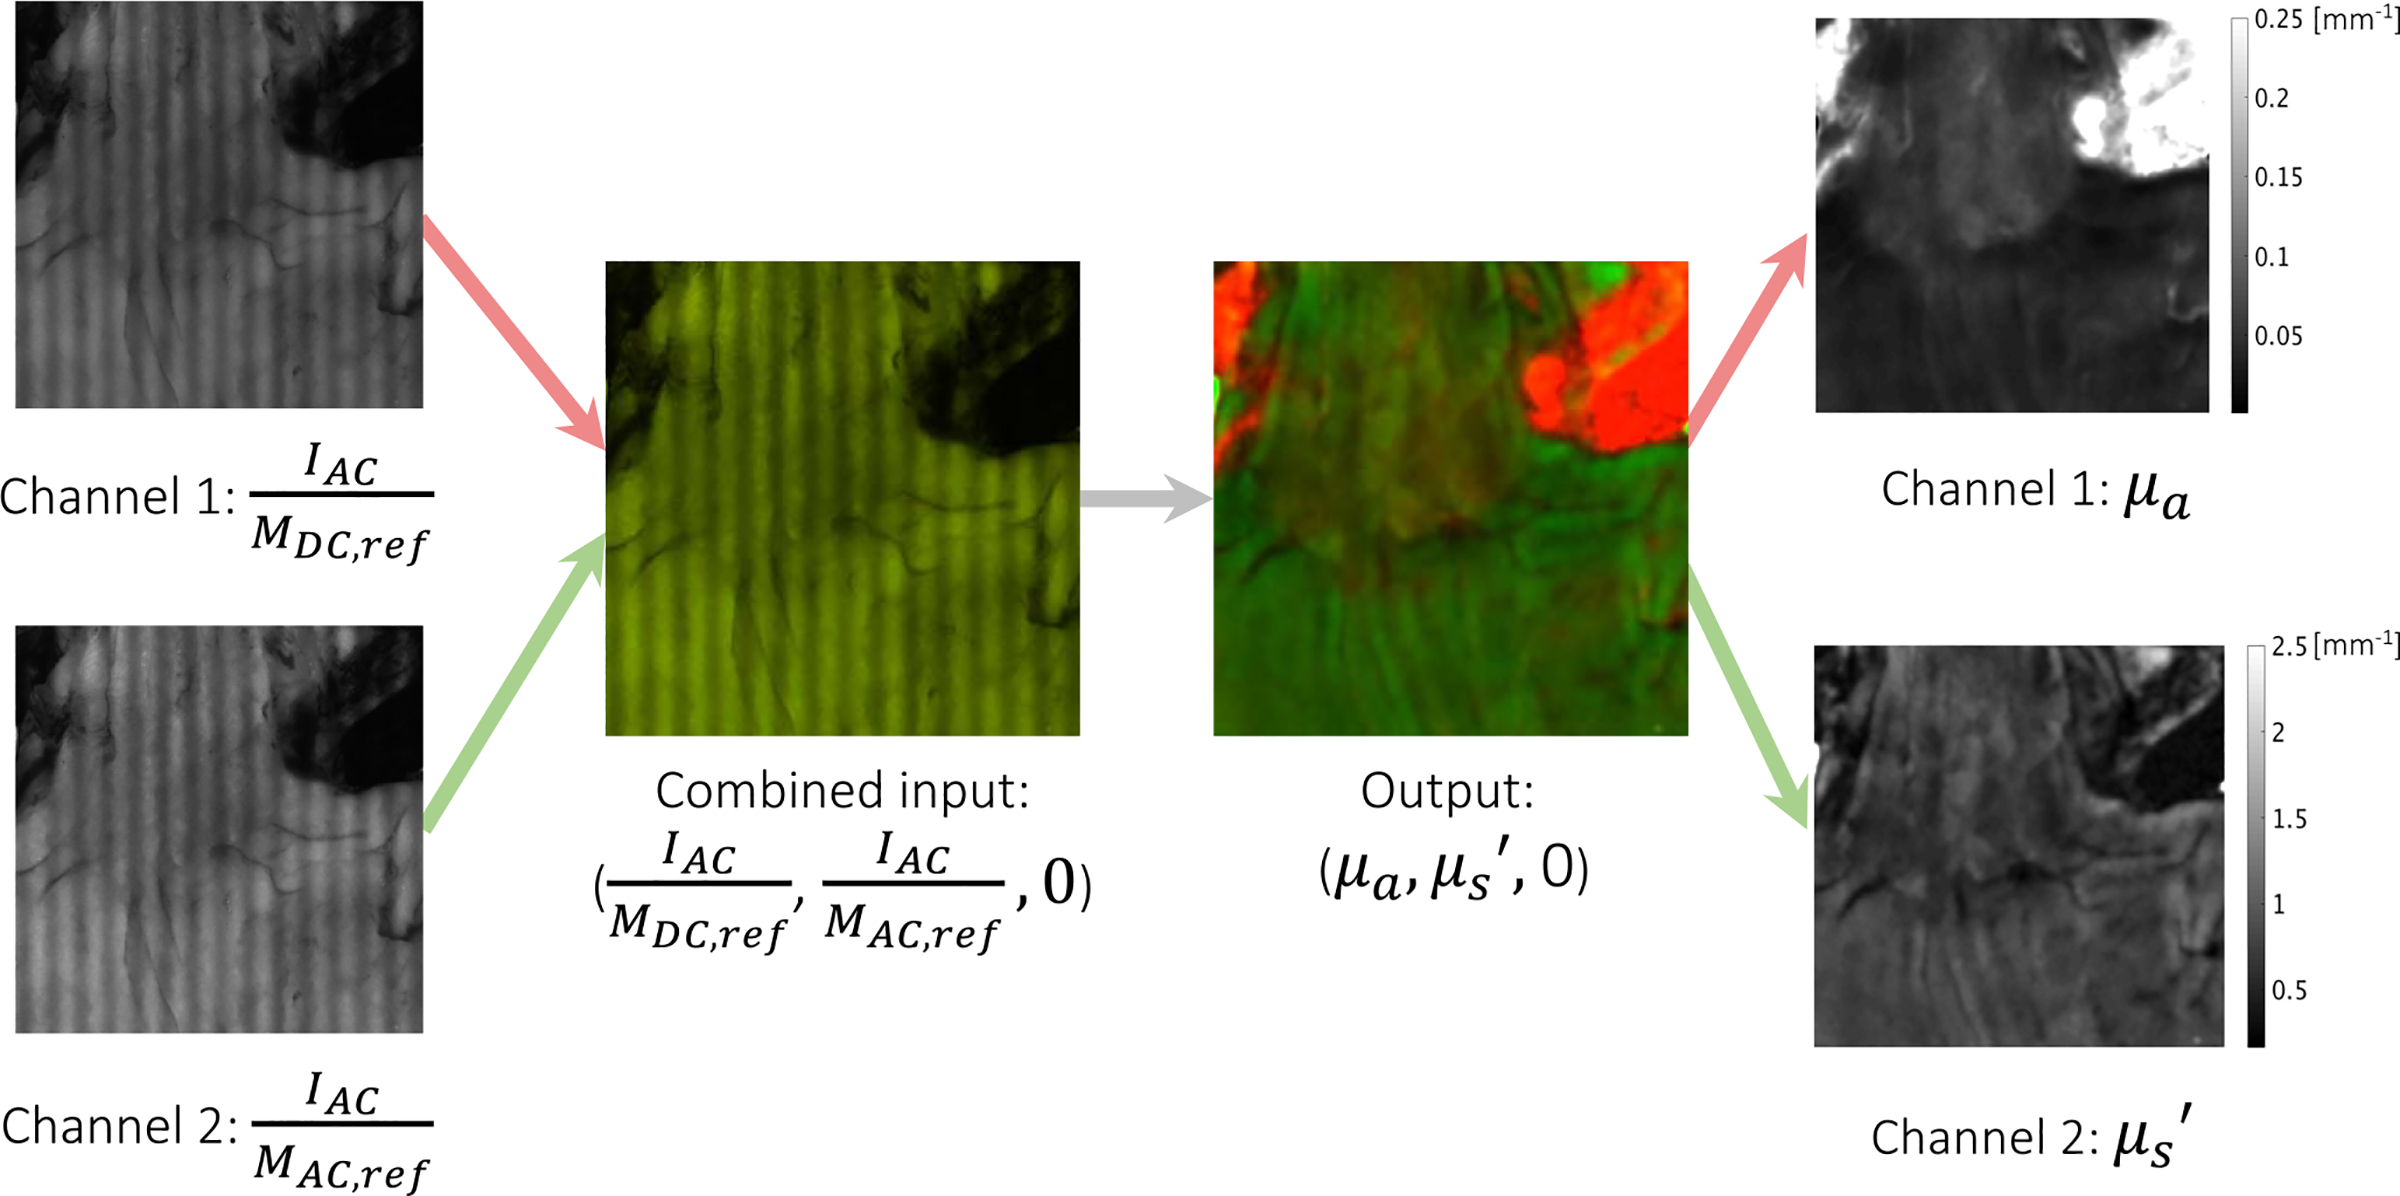
Example input-output pair used in N1 showing each individual channel as well as the combined RGB images. Channel 1 and 2 of the output contain μa and , respectively. Thus, a high absorption appears red while a high scattering appears green.

Example input-output pair used in N1 showing each individual channel as well as the combined RGB images. Channel 1 and 2 of the output contain μa and , respectively. Thus, a high absorption appears red while a high scattering appears green.