
Fig. 4.
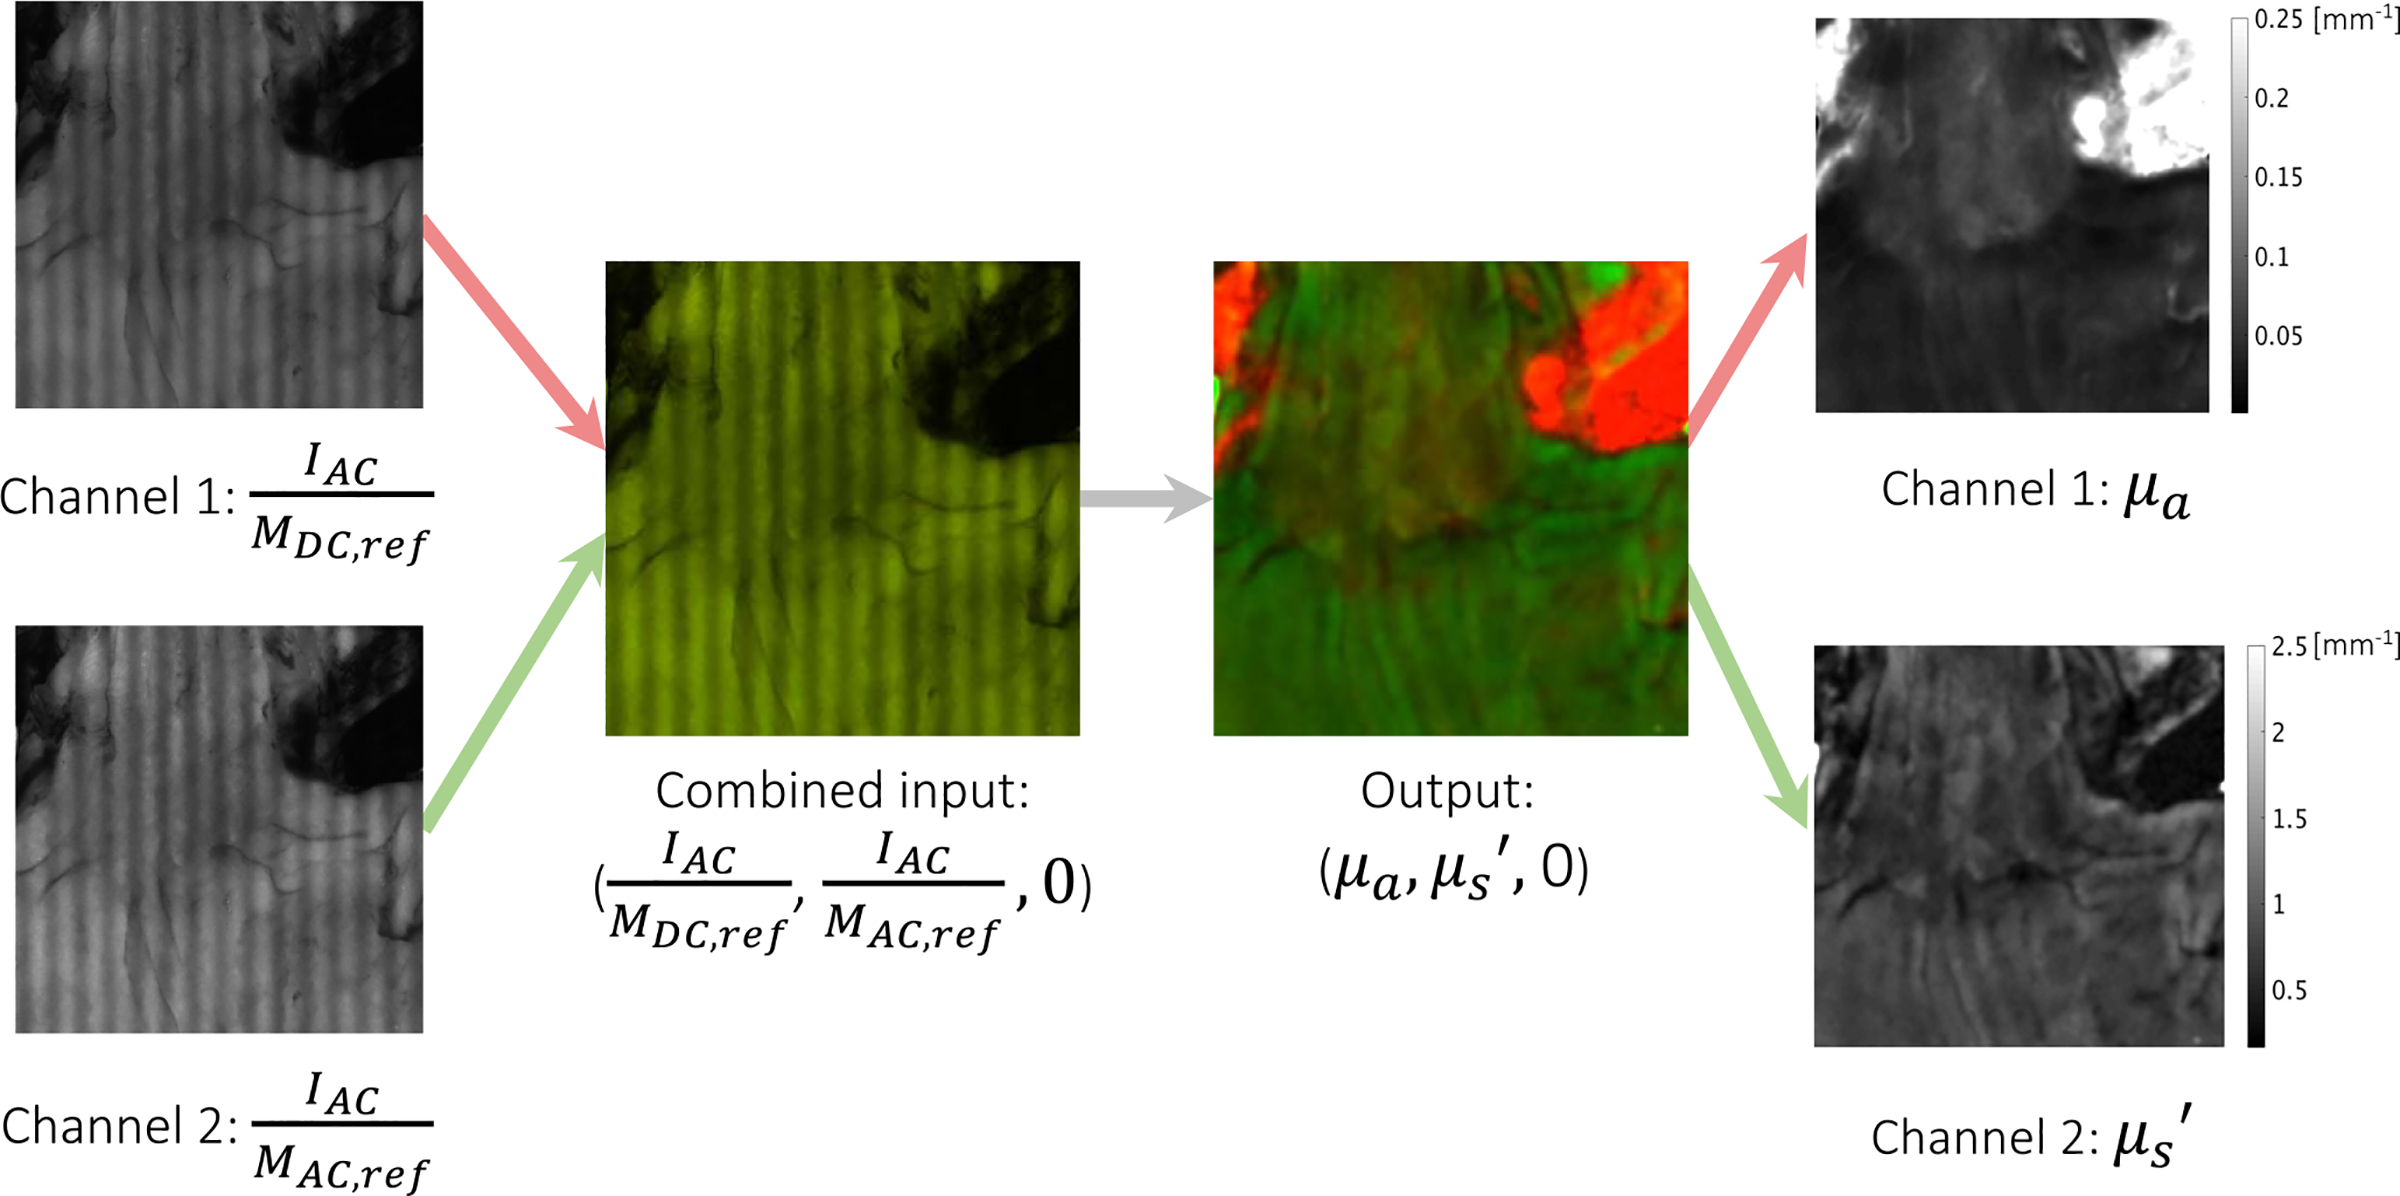
Example input-output pair used in N1 showing each individual channel as well as the combined RGB images. Channel 1 and 2 of the output contain μa and , respectively. Thus, a high absorption appears red while a high scattering appears green.
Official websites use .gov
A
.gov website belongs to an official
government organization in the United States.
Secure .gov websites use HTTPS
A lock (
) or https:// means you've safely
connected to the .gov website. Share sensitive
information only on official, secure websites.
Example input-output pair used in N1 showing each individual channel as well as the combined RGB images. Channel 1 and 2 of the output contain μa and , respectively. Thus, a high absorption appears red while a high scattering appears green.