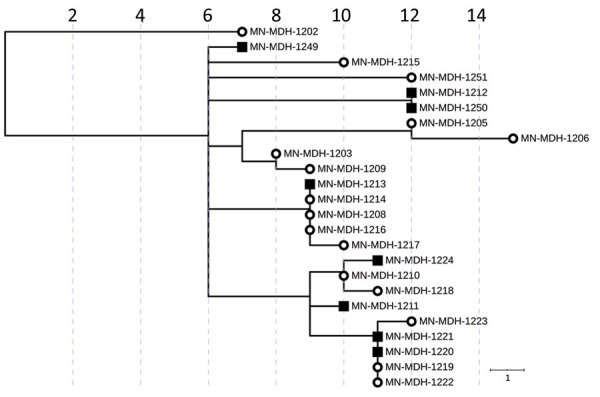
Figure 6.

Phylogenetic tree of SARS-CoV-2 genome sequences associated with meat-processing plant A and the surrounding community, Minnesota, USA, March 15–June 30, 2020. Open circles represent sequences from samples from staff at processing plant A; squares represent sequences from samples from persons in the surrounding community. IQ-TREE (29) was used with the general time reversible substitution model for tree generation. Branch lengths were scaled to represent number of single-nucleotide mutations, as shown in the scale. MDH, Minnesota Department of Health.
