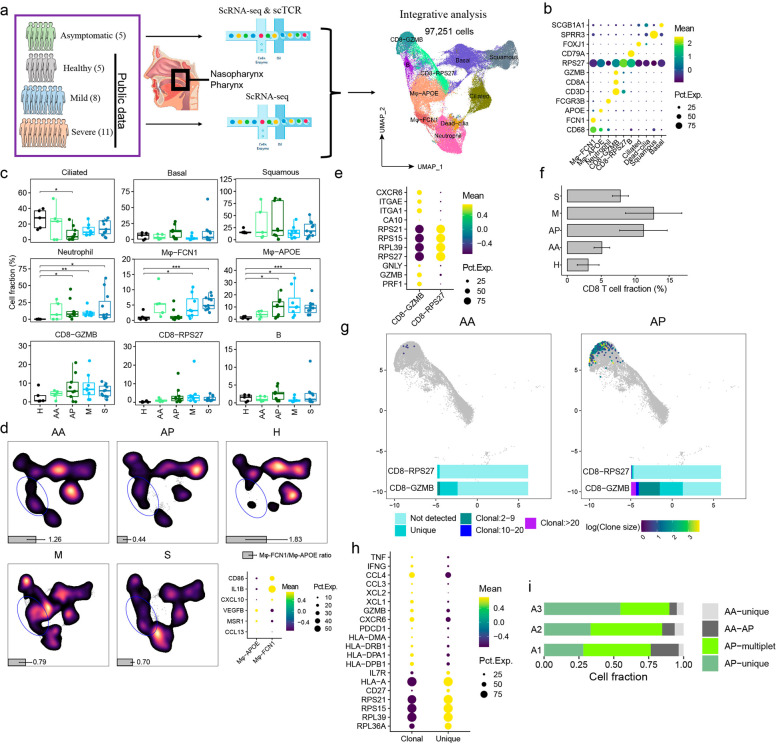
Fig. 1. Characterizing nasopharyngeal immune landscapes in asymptomatic and symptomatic SARS-CoV-2 infections.
a Illustration of the studied subjects and experimental scheme. b The canonical markers defining the nine major cell types. c Percentages of the nine cell types in nasopharyngeal swabs from healthy controls (H), early (AA) and late (AP) samples of asymptomatic carriers, the mildly (M) and severely (S) ill COVID-19 patients. (Two-sided t test. *P < 0.05; **P < 0.01; ***P < 0.001). d UMAP density plots showing the distribution of macrophages subtypes identified by inflammatory or anti-inflammatory markers (bottom right panel). Gray bars indicate the ratio of Mφ-FCN1/Mφ-APOE. e Expression of selected marker genes by CD8-GZMB and CD8-RPS27. f The proportion of total CD8+ T cells from each studied group. g The TCR clonal expansion status of the nasopharyngeal CD8+ T cells. h Selected differentially expressed genes by expanded vs non-expanded CD8+ T cells. i Following the “AA-to-AP” TCR dynamics in three asymptomatic individuals (AA–AP indicates TCR-sharing clonotypes between AA and AP; singlet and multiplet indicate non-sharing non-expanded or expanded TCR clonotypes, respectively).

