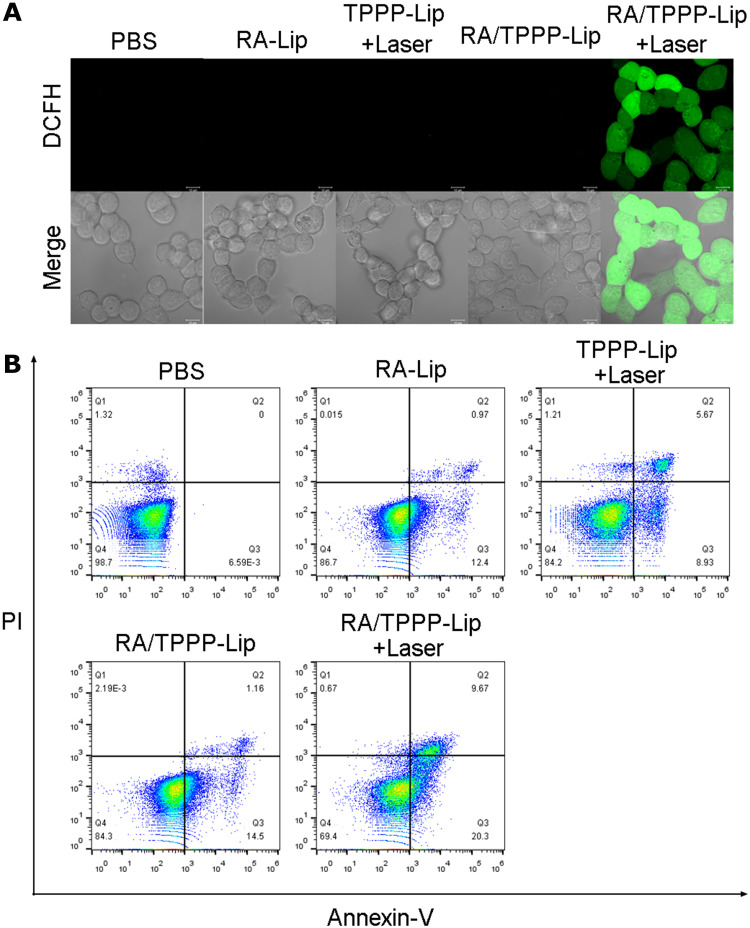
Figure 5.
(A) Confocal microscopy image of ROS levels in HCT116 cells treated with PBS (control), RA -Lip, TPPP-Lip with 660 nm laser irradiation, RA/TPPP-Lip, and RA/TPPP-Lip with 660 nm laser irradiation. Scale bar: 10 μm. (B) Flow cytometry assays of HCT116 cells treated with PBS (control), RA-Lip, TPPP-Lip with 660 nm laser irradiation, RA/TPPP-Lip, and RA/TPPP-Lip with 660 nm laser irradiation.

