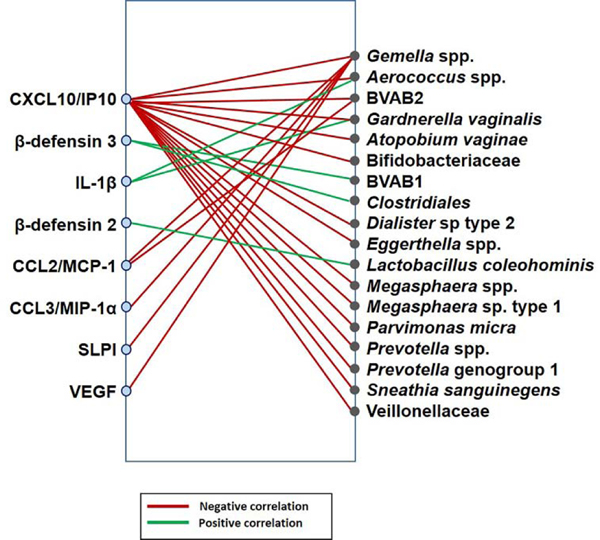
Figure 2. Network of associations between vaginal immune mediators and bacterial phylotypes in the overall study population.
Immune mediators and bacterial phylotypes are represented on the left and right sides of the plot, respectively. The lines indicate significant associations between vaginal immune mediators and bacterial phylotypes in the study population (N=52). Red lines indicate negative associations between the concentrations of vaginal immune mediators and the relative abundances of bacterial phylotypes. Green lines indicate positive associations between immune mediators and bacterial phylotypes. The analyses reflect linear mixed effects models, accounting for repeated measures and with an FDR<20%.

