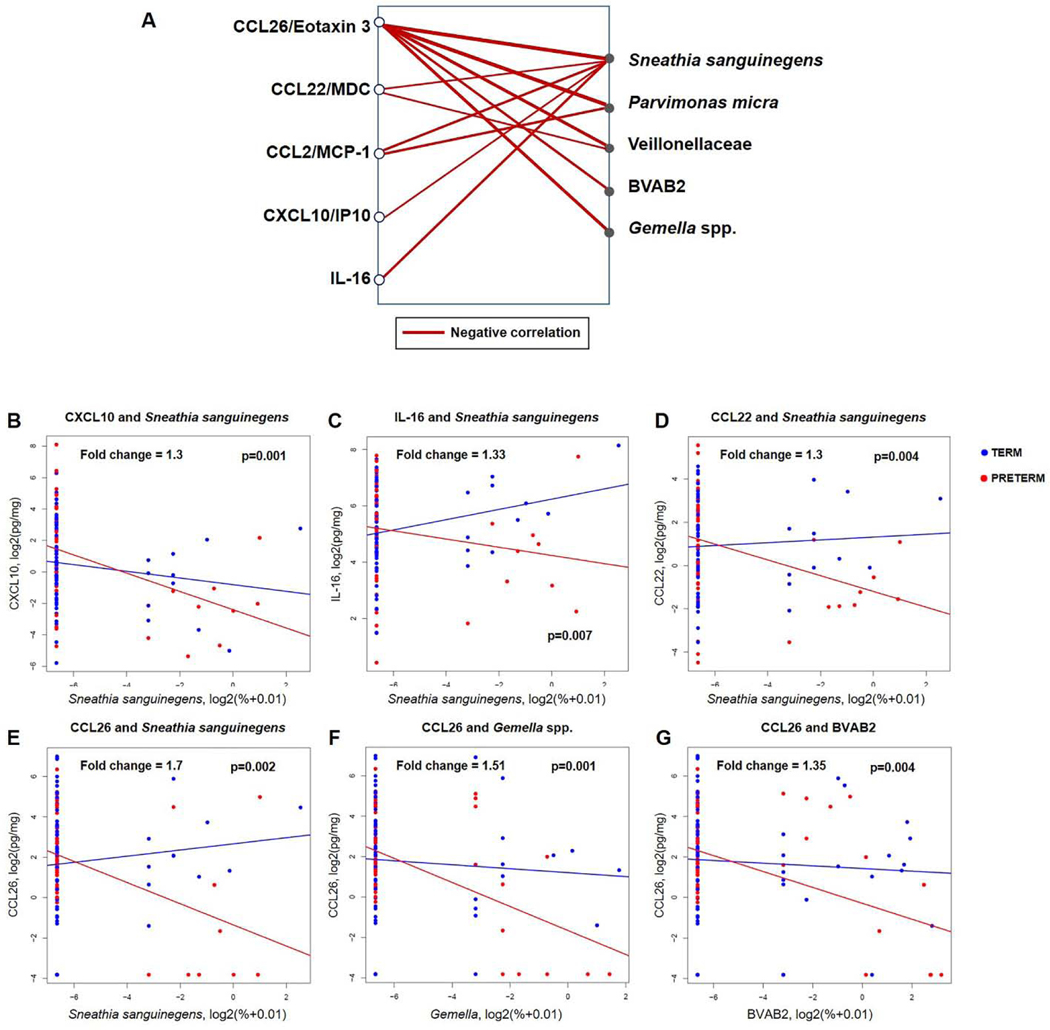
Figure 4. Network of immune mediators differentially associated with changes in bacterial phylotype relative abundances in preterm cases and term controls.
(A) Immune mediators and bacterial phylotypes are presented on the left and right sides of the plot, respectively. Red lines indicate a lower slope of the association between the concentration of an immune mediator and the relative abundance of a bacterial phylotype in preterm birth cases than in term controls. The fold changes represent a difference in the rate of change in the immune mediator concentration given a unit increase in bacterial phylotype relative abundance between cases and controls. Correlation analysis between vaginal concentrations of CXCL10 (B), IL-16 (C), CCL22 (D) and the relative abundance of Sneathia sanguinegens. Association between the vaginal concentrations of CCL26 and the relative abundance of Sneathia sanguinegens (E), Gemella spp. (F), and BVAB2 (G).

