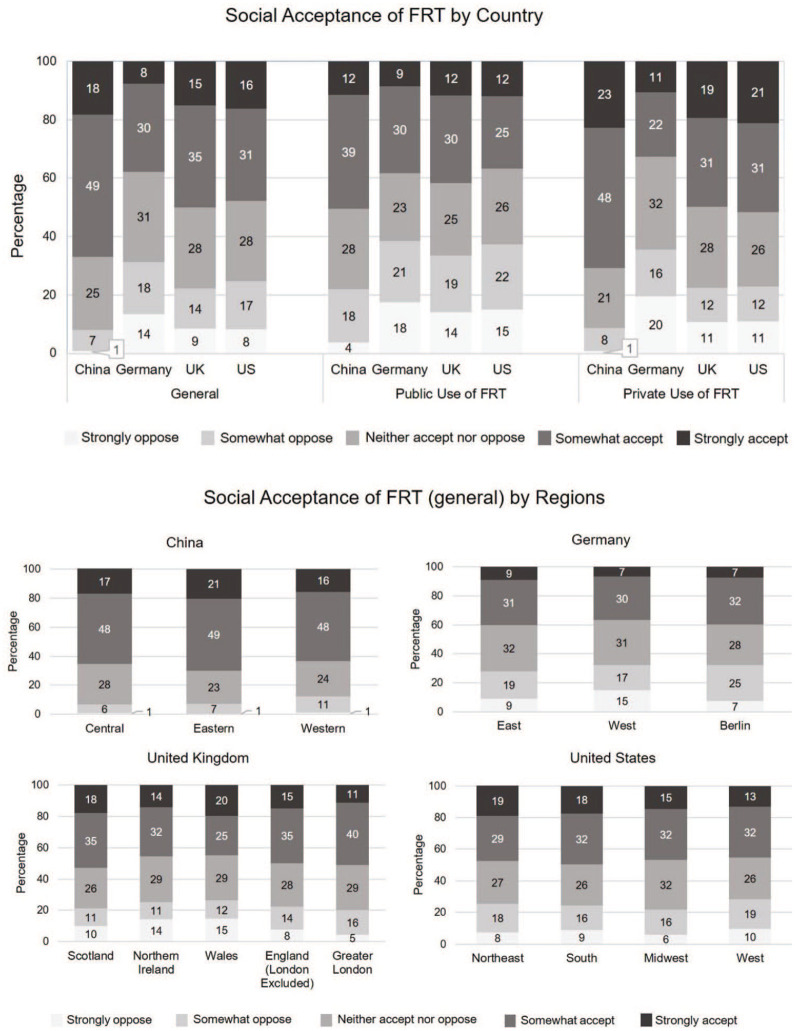
Figure 2.
Social acceptance of FRT by country and region.
Total N = 6099; distributions vary for regions: in China Central: N = 601, East: N = 686, West: N = 341; in Germany, East Germany: N = 172, West Germany: N = 1228, Berlin: N = 139; in the UK, Scotland: N = 207, Northern Ireland: N = 96, Wales: N = 37, England (London excluded): N = 1082, Greater London: N = 102; in the United States, Northeast: N = 269, South: N = 556, Midwest: N = 317, West: N = 268. For the United States, we use Census Data (US Census Bureau, 1995) to divide the states into four regions.

